| |
Presidential
Candidate | Home State | Political
Party | Primary Vote | Delegates |
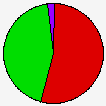
 | Hillary Clinton | New York | Democratic |
613,500 |
53.76% | 59 | 46.5% |
 | Barack Obama | Illinois | Democratic |
501,372 |
43.93% | 48 | 37.8% |
 | John Edwards | North Carolina | Democratic |
15,728 |
1.38% | 0 | 0.0% |
| Joe Biden | Delaware | Democratic |
4,081 |
0.36% | 0 | 0.0% |
| Bill Richardson | New Mexico | Democratic |
3,366 |
0.29% | 0 | 0.0% |
| Dennis J. Kucinich | Ohio | Democratic |
3,152 |
0.28% | 0 | 0.0% |
 | Unallocated | - | Democratic |
- |
- | 20 | 15.7% |
 |
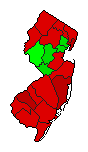
Map Key
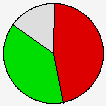
| Turnout
 |  |  |
|
|
| | Election Information: | | Contest Type: | State-run Primary | | Election Date: | 2008-02-05 | | Eligible Participants: | Modified Open (members of the party or independents) | | Delegates Awarded in this Contest: | 107 | | Delegates Total: | 127 | | Delegate Allocation Method: Proportional - the candidates are awarded delegates in proportion to the percentage of votes received. A 15% threshold is required to receive delegates. |
- 37 at-large delegates
- 70 district delegates (Legislative District)
- 20 unpledged delegates
- 3 delegates from Legislative Districts 1&2, 9&30, 16&23, 17&18, 19&20, 21&22, 24&25, 28&29, 31&33, 34&35
- 4 delegates from Legislative Districts 3&4, 5&6, 7&8, 10&11, 12&13, 14&15, 26&27, 32&36, 37&38, 39&40
|
|
| Demographic Data
| 2010 Population: | 8,791,894 | Enum. | 2010 Population Density: | 457.6 | persons/km2 | | 2008 Population: | 8,711,090 | Est. | 2008 Population Density: | 453.4 | persons/km2 | | 2000 Population: | 8,414,350 | Enum. | 2000 Population Density: | 438.0 | persons/km2 | | Total Delegates: | 127.0 | | Delegates Density: | 68,591 | persons/Del | | Land Area (2000): | 19,211 | km2 | Annual Pop Growth Rate: | 0.4 | % |
| Election Data and Statistics:
| Election Tools
|
| |


