Home
2024
Election Results
Election Info
Weblog
Forum
Wiki
Search
Email
Login
Site Info
Store
2008 Senatorial General Election Results
Note: The Google advertisement links below may advocate political positions that this site does not endorse.
Senatorial
Candidate
Political
Party
Popular Vote
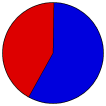
Lindsey Graham
Republican
1,076,534
57.52%
Bob Conley
Democratic
790,621
42.25%
Write-ins
-
4,276
0.23%
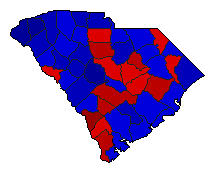
Map Key
> 40%
> 50%
> 60%
> 70%
Turnout
Maps
Demographic Data
2010 Population:
4,625,364
Enum.
2010 Population Density:
59.3
persons/km
2
2008 Population:
4,528,996
Est.
2008 Population Density:
58.1
persons/km
2
2000 Population:
4,012,012
Enum.
2000 Population Density:
51.4
persons/km
2
Land Area (2000):
77,983
km
2
Annual Pop Growth Rate:
1.4
%
Election Data and Statistics:
County Data (Table)
(m)
County Data (Graphs)
Purchase Detailed Data
Compare State Data by Year (Table)
Compare State Data by Year (Graphs)
View All 2008 South Carolina Data
Compare State Maps by Year
View All 2008 South Carolina Maps
Election Tools
Atlas Forum
Image Code for Maps:
County
,
Pop
,
Tnd
,
Swg
Data Sources:
Source for Popular Vote data: South Carolina State Election Commission.
2008 General Election Official Results U.S. Senate
, South Carolina State Election Commission ( ) (accessed 15 Nov 2008)
Source for Population data: U.S. Census Bureau.
Results for and Individual County:
Abbeville County
Aiken County
Allendale County
Anderson County
Bamberg County
Barnwell County
Beaufort County
Berkeley County
Calhoun County
Charleston County
Cherokee County
Chester County
Chesterfield County
Clarendon County
Colleton County
Darlington County
Dillon County
Dorchester County
Edgefield County
Fairfield County
Florence County
Georgetown County
Greenville County
Greenwood County
Hampton County
Horry County
Jasper County
Kershaw County
Lancaster County
Laurens County
Lee County
Lexington County
McCormick County
Marion County
Marlboro County
Newberry County
Oconee County
Orangeburg County
Pickens County
Richland County
Saluda County
Spartanburg County
Sumter County
Union County
Williamsburg County
York County
The 2008 Campaign:
Pre-Election Polls
< 2004
Choose Year
2022
2020
2016
2014
2014
2010
2004
2002
1998
1996
1992
1990
1986
1984
1980
1978
1974
1972
1968
1954
Choose Office
President
Choose State
Alabama Class 2
Alaska Class 2
Arkansas Class 2
Colorado Class 2
Delaware Class 2
Georgia Class 2
Idaho Class 2
Illinois Class 2
Iowa Class 2
Kansas Class 2
Kentucky Class 2
Louisiana Class 2
Maine Class 2
Massachusetts Class 2
Michigan Class 2
Minnesota Class 2
Mississippi Class 1
Mississippi Class 2
Montana Class 2
Nebraska Class 2
New Hampshire Class 2
New Jersey Class 2
New Mexico Class 2
North Carolina Class 2
Oklahoma Class 2
Oregon Class 2
Rhode Island Class 2
South Dakota Class 2
Tennessee Class 2
Texas Class 2
Virginia Class 2
West Virginia Class 2
Wyoming Class 1
Wyoming Class 2
District of Columbia
2010 >
South Carolina Election Results Home
-
National Results for 2008
-
Use Frame Navigation
Login
Terms of Use
-
DCMA Policy
-
Privacy Policy and Cookies
©
Dave Leip's Atlas of U.S. Elections, LLC 2019 All Rights Reserved


