Home
2024
Election Results
Election Info
Weblog
Forum
Wiki
Search
Email
Login
Site Info
Store
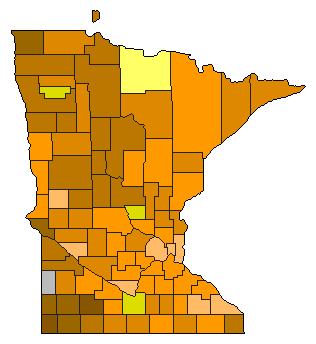
2012 Presidential Republican Primary Election Results
Note: The Google advertisement links below may advocate political positions that this site does not endorse.
Unofficial Results
Presidential
Candidate
Home State
Political
Party
Caucus Result
Delegates
Rick Santorum
Virginia
Republican
21,988
44.95%
0
0.0%
Ron Paul
Texas
Republican
13,282
27.15%
0
0.0%
Mitt Romney
Massachusetts
Republican
8,240
16.85%
0
0.0%
Newt Gingrich
Virginia
Republican
5,263
10.76%
0
0.0%
Other Candidates
-
Republican
143
0.29%
0
0.0%
Unallocated
-
Republican
-
-
40
100.0%
Map Key
> 30%
> 40%
> 50%
> 60%
Turnout
Maps
Election Information:
Contest Type:
Party-run Caucus/Convention
Caucus Date:
2012-02-07
Eligible Participants:
Open (all voters)
Delegates Awarded in this Contest:
0
Delegates Total:
40
Statewide Delegates:
Caucus and/or conventions - delegates are awarded through the Caucus and Convention system
Demographic Data
2012 Population:
5,377,500
Est.
2012 Population Density:
26.1
persons/km
2
2010 Population:
5,303,925
Enum.
2010 Population Density:
25.7
persons/km
2
Total Delegates:
40
Delegates Density:
134,438
persons/Del
Land Area (2000):
206,189
km
2
Annual Pop Growth Rate:
0.7
%
Election Data and Statistics:
County Data (Table)
(m)
County Data (Graphs)
Purchase Detailed Data
Compare State Maps by Year
View All 2012 Minnesota Maps
Election Tools
2012 Republican Primary Timeline
Atlas Forum
Image Code for Maps:
County
,
Pop
Data Sources:
Source for Popular Vote data:
Source for Population data: U.S. Census Bureau.
Results for and Individual County:
Aitkin County
Anoka County
Becker County
Beltrami County
Benton County
Big Stone County
Blue Earth County
Brown County
Carlton County
Carver County
Cass County
Chippewa County
Chisago County
Clay County
Clearwater County
Cook County
Cottonwood County
Crow Wing County
Dakota County
Dodge County
Douglas County
Faribault County
Fillmore County
Freeborn County
Goodhue County
Grant County
Hennepin County
Houston County
Hubbard County
Isanti County
Itasca County
Jackson County
Kanabec County
Kandiyohi County
Kittson County
Koochiching County
Lac Qui Parle County
Lake County
Lake of the Woods County
Le Sueur County
Lincoln County
Lyon County
McLeod County
Mahnomen County
Marshall County
Martin County
Meeker County
Mille Lacs County
Morrison County
Mower County
Murray County
Nicollet County
Nobles County
Norman County
Olmsted County
Otter Tail County
Pennington County
Pine County
Pipestone County
Polk County
Pope County
Ramsey County
Red Lake County
Redwood County
Renville County
Rice County
Rock County
Roseau County
St. Louis County
Scott County
Sherburne County
Sibley County
Stearns County
Steele County
Stevens County
Swift County
Todd County
Traverse County
Wabasha County
Wadena County
Waseca County
Washington County
Watonwan County
Wilkin County
Winona County
Wright County
Yellow Medicine County
Unofficial Results
Presidential
Candidate
Home State
Political
Party
County Convention
Vote
Delegates
Ron Paul
Texas
Republican
0
0.00%
20
50.0%
Rick Santorum
Virginia
Republican
0
0.00%
2
5.0%
Unallocated
-
Republican
-
-
18
45.0%
Map Key
> 40%
> 50%
> 60%
> 70%
Turnout
Election Information:
Contest Type:
Party-run County Conventions
Eligible Participants:
Closed (only members of the party)
Delegates Awarded in this Contest:
24
Delegates Total:
40
Statewide Delegates:
Caucus and/or conventions - delegates are awarded through the Caucus and Convention system
Demographic Data
2012 Population:
5,377,500
Est.
2012 Population Density:
26.1
persons/km
2
2010 Population:
5,303,925
Enum.
2010 Population Density:
25.7
persons/km
2
Total Delegates:
40
Delegates Density:
134,438
persons/Del
Land Area (2000):
206,189
km
2
Annual Pop Growth Rate:
0.7
%
Election Data and Statistics:
Purchase Detailed Data
Data Sources:
Source for Popular Vote data:
Source for Population data: U.S. Census Bureau.
Unofficial Results
Presidential
Candidate
Home State
Political
Party
State Convention Vote
Delegates
Ron Paul
Texas
Republican
0
0.00%
12
30.0%
Michele Bachmann
Minnesota
Republican
0
0.00%
1
2.5%
Unallocated
-
Republican
-
-
27
67.5%
Map Key
> 40%
> 50%
> 60%
> 70%
Turnout
Election Information:
Contest Type:
Party-run State Convention
Eligible Participants:
Closed (only members of the party)
Delegates Awarded in this Contest:
13
Delegates Total:
40
Statewide Delegates:
Caucus and/or conventions - delegates are awarded through the Caucus and Convention system
Demographic Data
2012 Population:
5,377,500
Est.
2012 Population Density:
26.1
persons/km
2
2010 Population:
5,303,925
Enum.
2010 Population Density:
25.7
persons/km
2
Total Delegates:
40
Delegates Density:
134,438
persons/Del
Land Area (2000):
206,189
km
2
Annual Pop Growth Rate:
0.7
%
Election Data and Statistics:
Purchase Detailed Data
Data Sources:
Source for Popular Vote data:
Source for Population data: U.S. Census Bureau.
< 2008
Choose Year
2024
2016
2008
2000
1996
Choose Office
Senator
Choose Party
Democratic
Choose State
Alabama
Alaska
American Samoa
Arizona
Arkansas
California
Colorado
Colorado
Colorado
Connecticut
Delaware
District of Columbia
Florida
Georgia
Guam
Hawaii
Idaho
Illinois
Indiana
Iowa
Kansas
Kentucky
Louisiana
Maine
Maryland
Massachusetts
Michigan
Mississippi
Missouri
Missouri
Missouri
Montana
Montana
N. Mariana Isl.
Nebraska
Nebraska
Nevada
New Hampshire
New Jersey
New Mexico
New York
North Carolina
North Dakota
Ohio
Oklahoma
Oregon
Pennsylvania
Puerto Rico
Rhode Island
South Carolina
South Dakota
Tennessee
Texas
Utah
Vermont
Virgin Islands
Virginia
Washington
West Virginia
Wisconsin
Wyoming
Wyoming
Wyoming
2016 >
Minnesota Election Results Home
-
National Results for 2012
-
Use Frame Navigation
Login
Terms of Use
-
DCMA Policy
-
Privacy Policy and Cookies
©
Dave Leip's Atlas of U.S. Elections, LLC 2019 All Rights Reserved


