Home
2024
Election Results
Election Info
Weblog
Forum
Wiki
Search
Email
Login
Site Info
Store
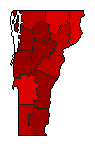
2018 Representative General Election Results
Note: The Google advertisement links below may advocate political positions that this site does not endorse.
Representative
Candidate
Political
Party
Popular Vote
Peter Welch
Democratic
188,547
69.20%
Anya Tynio
Republican
70,705
25.95%
Cris Ericson
Independent
9,110
3.34%
Laura S. Potter
Liberty Union
3,924
1.44%
Write-ins
-
165
0.06%
Map Key
> 40%
> 50%
> 60%
> 70%
Turnout
Maps
Election Data and Statistics:
County Data (Table)
(m)
County Data (Graphs)
Congressional District Data
(m)
City and Town Data
(m)
Purchase Detailed Data
Compare State Data by Year (Table)
Compare State Data by Year (Graphs)
View All 2018 Vermont Data
Compare State Maps by Year
View All 2018 Vermont Maps
Election Tools
Atlas Forum
Image Code for Maps:
County
,
CD
,
Town
,
Pop
Data Sources:
Source for Popular Vote data:
Source for Population data: U.S. Census Bureau.
Results for and Individual County:
Addison County
Bennington County
Caledonia County
Chittenden County
Essex County
Franklin County
Grand Isle County
Lamoille County
Orange County
Orleans County
Rutland County
Washington County
Windham County
Windsor County
The 2018 Campaign:
Pre-Election Polls
< 2016
Choose Year
2022
2020
2016
2014
2012
Choose Office
Senator
Governor
Lt. Governor
Choose State
Alaska
Delaware
Montana
North Dakota
South Dakota
Wyoming
2020 >
Vermont Election Results Home
-
National Results for 2018
-
Use Frame Navigation
View Large Map Page for This Contest
Login
Terms of Use
-
DCMA Policy
-
Privacy Policy and Cookies
©
Dave Leip's Atlas of U.S. Elections, LLC 2019 All Rights Reserved


