Note: The Google advertisement links below may advocate political positions that this site does not endorse.
Official Results
  Presidential
Candidate
Vice Presidential
Candidate
Political
Party
Popular VoteElectoral Vote
Barack H. ObamaJoseph R. Biden, Jr.Democratic 199,239 66.57%3
Willard Mitt RomneyPaul RyanRepublican 92,698 30.97%0
Gary JohnsonJames P. GrayLibertarian 3,487 1.17%0
Write-ins-- 1,427 0.48%0
Ross C. 'Rocky' AndersonLuis J. RodriguezJustice 1,128 0.38%0
YOther (+) - - 1,311 0.44%0
Total Vote 299,290
Maps
2012 Presidential General Election - Vermont Election County Map
County H
County Pop H
2008 Button H
Per Vote Democratic Button H
Per Vote Republican Button H
Swing Map Button H
Trend Map Button H
Town H
Last Button H
Per Vote Democratic Button H
Per Vote Republican Button H
Swing Map Button H
Trend Map Button H
County H
 
(Note: click the 'H' buttons above to hold the given map and change the image map)
PerDemocraticRepublicanPie
>20%
 
0
 
 
0
 
pie
>30%
 
0
 
 
0
 
>40%
 
4
 
 
4
 
>50%
 
66
 
 
66
 
>60%
 
120
 
 
120
 
>70%
 
46
 
 
46
 
>80%
 
8
 
 
8
 
>90%
 
0
 
 
0
 
 Election Data and Statistics:
Data Sources:
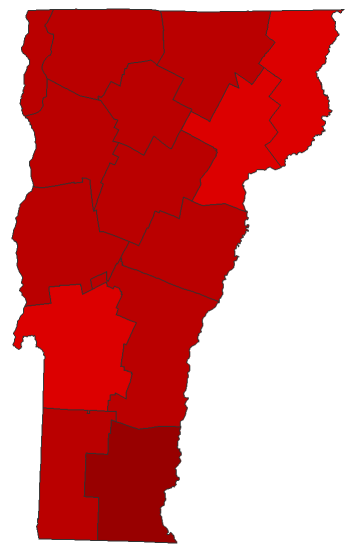
  • Source for Popular Vote data: Vermont Office of the Secretary of State Elections Division. Complete Official Results & Voter Turnout November 6, 2012 General Election, Vermont Office of the Secretary of State Elections Division (http://vermont-elections.org/elections1/2012ElectionResults/2012_election_info.html ) (accessed 13 Nov 2012)
Election Notes:
  • Write-in figures for Stein, Goode, Barr were tabulated by volunteers at Vermont Secretary of State (source: Richard Winger - Ballot Access News)


Classic Vermont Results for 2012 - National Results for 2012

Login

Terms of Use - DCMA Policy - Privacy Policy and Cookies


© Dave Leip's Atlas of U.S. Elections, LLC 2019 All Rights Reserved