Note: The Google advertisement links below may advocate political positions that this site does not endorse.
Official Results
  Presidential
Candidate
Vice Presidential
Candidate
Political
Party
Popular VoteElectoral Vote
Barack H. ObamaJoseph R. Biden, Jr.Democratic 1,620,985 52.83%10
Willard Mitt RomneyPaul RyanRepublican 1,407,966 45.89%0
Gary JohnsonJames P. GrayLibertarian 20,439 0.67%0
YOther (+) - - 19,044 0.62%0
Total Vote 3,068,434
Maps
2012 Presidential General Election - Wisconsin Election County Map
County H
County Pop H
2008 Button H
Per Vote Democratic Button H
Per Vote Republican Button H
Swing Map Button H
Trend Map Button H
Town H
Last Button H
Per Vote Democratic Button H
Per Vote Republican Button H
Swing Map Button H
Trend Map Button H
County H
 
(Note: click the 'H' buttons above to hold the given map and change the image map)
PerDemocraticRepublicanPie
>20%
 
0
 
 
0
 
pie
>30%
 
0
 
 
0
 
>40%
 
52
 
 
52
 
>50%
 
537
 
 
537
 
>60%
 
191
 
 
191
 
>70%
 
35
 
 
35
 
>80%
 
8
 
 
8
 
>90%
 
2
 
 
2
 
 Election Data and Statistics:
Data Sources:
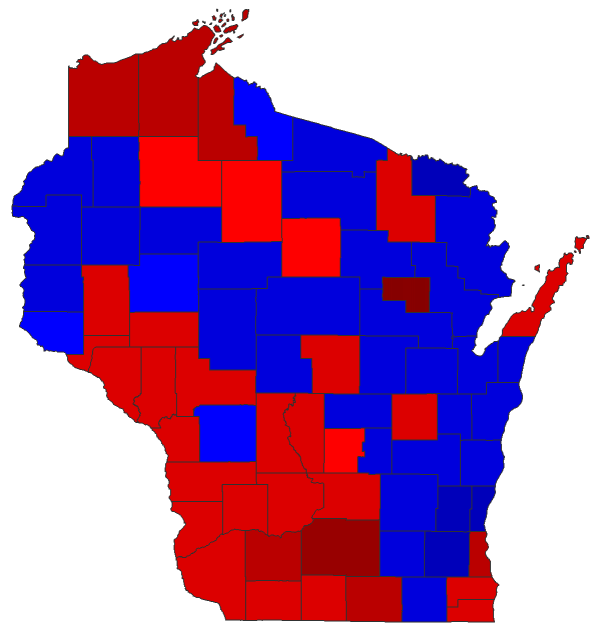
  • Source for Popular Vote data: Wisconsin Government Accountability Board. G.A.B. Canvass Reporting System County by County Report 2012 Presidential and General Election - President of the United States, Wisconsin Government Accountability Board (http://gab.wi.gov/sites/default/files/Amended%20County%20Report-11.6.12%20President.pdf ) (accessed 08 Jan 2012)
Election Notes:
  • Gloria La Riva is a stand-in Presidential Candidate for Peta Lindsay


Classic Wisconsin Results for 2012 - National Results for 2012

Login

Terms of Use - DCMA Policy - Privacy Policy and Cookies


© Dave Leip's Atlas of U.S. Elections, LLC 2019 All Rights Reserved