Note: The Google advertisement links below may advocate political positions that this site does not endorse.
Official Results
  Presidential
Candidate
Home StatePolitical
Party
Primary VoteDelegates
Hillary ClintonNew YorkDemocratic 1,039,555 50.56%78 42.9%
Bernie SandersVermontDemocratic 999,494 48.61%78 42.9%
Willie WilsonIllinoisDemocratic 6,565 0.32%0 0.0%
Martin O'MalleyMarylandDemocratic 6,197 0.30%0 0.0%
YOther (+) - Democratic 4,236 0.21%00%
YUnallocated - Democratic - -2614.3%
Total Vote 2,056,047
Maps
2016 Presidential Democratic Primary - Illinois Election County Map
County H
County Pop H
Per Vote Democratic Button H
Town H
Per Vote Democratic Button H
 
(Note: click the 'H' buttons above to hold the given map and change the image map)
PerClintonSandersPie
>20%
 
0
 
 
0
 
pie
>30%
 
1
 
 
1
 
>40%
 
78
 
 
78
 
>50%
 
348
 
 
348
 
>60%
 
95
 
 
95
 
>70%
 
26
 
 
26
 
>80%
 
9
 
 
9
 
>90%
 
0
 
 
0
 
 Election Data and Statistics:
Data Sources:
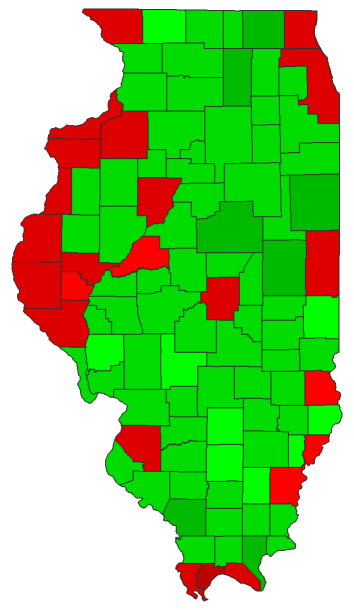
  • Source for Popular Vote data: Illinois State Board of Elections. 2016 General Primary Official Vote Totals Book - President of the United States (pp. 1-13), Illinois State Board of Elections (http://www.elections.il.gov/Downloads/ElectionInformation/VoteTotals/2016GPOfficialVote.pdf) (accessed 16 Apr 2016)


Classic Illinois Results for 2016 - National Results for 2016

Login

Terms of Use - DCMA Policy - Privacy Policy and Cookies


© Dave Leip's Atlas of U.S. Elections, LLC 2019 All Rights Reserved