Home
2024
Election Results
Election Info
Weblog
Forum
Wiki
Search
Email
Login
Site Info
Store
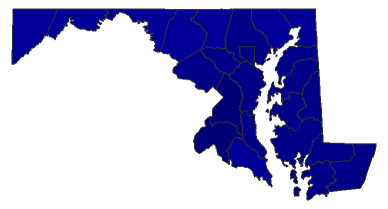
2020 Presidential Democratic Primary - Maryland
Note: The Google advertisement links below may advocate political positions that this site does not endorse.
Choose Office
Official Results
Choose State
Alabama Primary
Alaska Primary
Alaska Caucus - Final
Arizona Primary
Arkansas Primary
California Primary
Colorado Primary
Connecticut Primary
Delaware Primary
District of Columbia Primary
Florida Primary
Georgia Primary
Hawaii Primary
Hawaii Caucus - Final
Idaho Primary
Illinois Primary
Indiana Primary
Iowa Caucus - Final
Iowa Caucus
Kansas Primary
Kansas Caucus - Final
Kentucky Primary
Louisiana Primary
Maine Primary
Maryland Primary
Massachusetts Primary
Michigan Primary
Minnesota Primary
Mississippi Primary
Missouri Primary
Montana Primary
Nebraska Primary
Nevada Caucus - Final
Nevada Caucus
New Hampshire Primary
New Jersey Primary
New Mexico Primary
New York Primary
North Carolina Primary
North Dakota Caucus
Ohio Primary
Oklahoma Primary
Oregon Primary
Pennsylvania Primary
Rhode Island Primary
South Carolina Primary
South Dakota Primary
Tennessee Primary
Texas Primary
Utah Primary
Vermont Primary
Virginia Primary
Washington Primary
West Virginia Primary
Wisconsin Primary
Wyoming Caucus
Wyoming Caucus - Final
American Samoa Caucus
Guam Caucus
N. Mariana Isl. Convention
Puerto Rico Primary
Virgin Islands Caucus
Presidential
Candidate
Home State
Political
Party
Primary Vote
Delegates
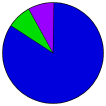
Joe Biden
Delaware
Democratic
879,753
83.72%
96
80.7%
Bernie Sanders
Vermont
Democratic
81,939
7.80%
0
0.0%
Elizabeth Warren
Massachusetts
Democratic
27,134
2.58%
0
0.0%
Uncommitted
-
Democratic
23,726
2.26%
0
0.0%
Pete Buttigieg
Indiana
Democratic
7,180
0.68%
0
0.0%
Mike Bloomberg
New York
Democratic
6,773
0.64%
0
0.0%
Andrew Yang
New York
Democratic
6,670
0.63%
0
0.0%
Amy Klobuchar
Minnesota
Democratic
5,685
0.54%
0
0.0%
Tulsi Gabbard
Hawaii
Democratic
4,226
0.40%
0
0.0%
Cory Booker
New Jersey
Democratic
2,662
0.25%
0
0.0%
Michael Bennet
Colorado
Democratic
2,291
0.22%
0
0.0%
Marianne Williamson
Iowa
Democratic
897
0.09%
0
0.0%
Julian Castro
Texas
Democratic
760
0.07%
0
0.0%
Tom Steyer
California
Democratic
671
0.06%
0
0.0%
Deval Patrick
Massachusetts
Democratic
406
0.04%
0
0.0%
Unallocated
-
Democratic
-
-
23
19.3%
Total Vote
1,050,773
Maps
(Note: click the 'H' buttons above to hold the given map and change the image map)
Per
Biden
Sanders
Pie
>20%
>30%
>40%
>50%
>60%
>70%
>80%
>90%
Election Data and Statistics:
County Data (Table)
(m)
County Data (Graphs)
Purchase Detailed Data
Compare State Maps by Year
View All 2020 Maryland Maps
Data Sources:
Source for Popular Vote data:
< 2016
Choose Year
2016
Classic Maryland Results for 2020
-
National Results for 2020
Login
Terms of Use
-
DCMA Policy
-
Privacy Policy and Cookies
©
Dave Leip's Atlas of U.S. Elections, LLC 2019 All Rights Reserved