Home
2024
Election Results
Election Info
Weblog
Forum
Wiki
Search
Email
Login
Site Info
Store
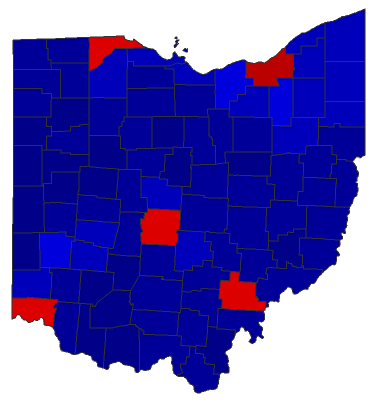
2022 Attorney General General Election - Ohio
Note: The Google advertisement links below may advocate political positions that this site does not endorse.
Choose Office
Senator Class 3
Governor
Secretary of State
State Treasurer
State Auditor
Official Results
Choose State
Alabama
Arizona
Arkansas
Colorado
Connecticut
Delaware
Florida
Georgia
Idaho
Illinois
Iowa
Kansas
Maryland
Massachusetts
Michigan
Minnesota
Nebraska
Nevada
New Mexico
New York
North Dakota
Ohio
Oklahoma
Rhode Island
South Carolina
South Dakota
Texas
Vermont
Wisconsin
Attorney General
Candidate
Political
Party
Popular Vote
Dave Yost
Republican
2,484,753
60.13%
Jeffrey A. Crossman
Democratic
1,647,644
39.87%
Total Vote
4,132,397
Maps
(Note: click the 'H' buttons above to hold the given map and change the image map)
Per
Democratic
Republican
Pie
>20%
>30%
>40%
>50%
>60%
>70%
>80%
>90%
Election Data and Statistics:
County Data (Table)
(m)
County Data (Graphs)
Purchase Detailed Data
Compare State Data by Year (Table)
Compare State Data by Year (Graphs)
View All 2022 Ohio Data
Compare State Maps by Year
View All 2022 Ohio Maps
Data Sources:
Source for Popular Vote data:
Choose Year
2018
2014
2010
Classic Ohio Results for 2022
-
National Results for 2022
Login
Terms of Use
-
DCMA Policy
-
Privacy Policy and Cookies
©
Dave Leip's Atlas of U.S. Elections, LLC 2019 All Rights Reserved