Home
2024
Election Results
Election Info
Weblog
Forum
Wiki
Search
Email
Login
Site Info
Store
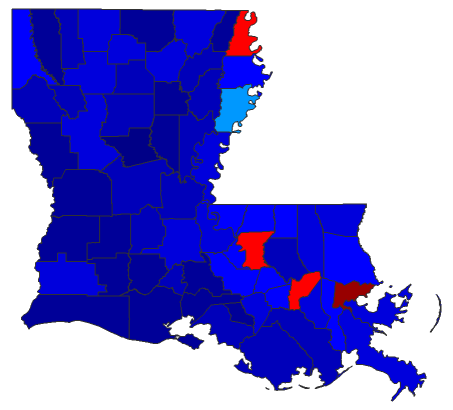
2023 Gubernatorial General Election - Louisiana
Note: The Google advertisement links below may advocate political positions that this site does not endorse.
Choose Office
Lt. Governor
Official Results
Choose State
Kentucky
Louisiana
Mississippi
Gubernatorial
Candidate
Political
Party
Popular Vote
'Jeff' Landry
Republican
547,827
51.56%
Shawn D. Wilson
Democratic
275,525
25.93%
Stephen 'Wags' Waguespack
Republican
62,287
5.86%
John Schroder
Republican
56,654
5.33%
Hunter Lundy
Independent
52,165
4.91%
Daniel M. 'Danny' Cole
Democratic
27,662
2.60%
Sharon W. Hewitt
Republican
18,468
1.74%
Benjamin Barnes
Independent
5,190
0.49%
Patrick Henry 'Dat' Barthel
Republican
4,426
0.42%
Richard Nelson
Republican
3,605
0.34%
Jeffery Istre
Independent
3,400
0.32%
Other (
+
)
-
5,289
0.50%
Total Vote
1,062,498
Maps
(Note: click the 'H' buttons above to hold the given map and change the image map)
Per
Democratic
Republican
Independent
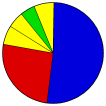
Pie
>20%
>30%
>40%
>50%
>60%
>70%
>80%
>90%
Election Data and Statistics:
Parish Data (Table)
(m)
Parish Data (Graphs)
Precinct Data
(m)
Precinct Data Search
(m)
Purchase Detailed Data
Compare State Data by Year (Table)
Compare State Data by Year (Graphs)
View All 2023 Louisiana Data
Compare State Maps by Year
View All 2023 Louisiana Maps
Data Sources:
Source for Popular Vote data:
< 2019
Choose Year
2019
2015
2011
Classic Louisiana Results for 2023
-
National Results for 2023
Login
Terms of Use
-
DCMA Policy
-
Privacy Policy and Cookies
©
Dave Leip's Atlas of U.S. Elections, LLC 2019 All Rights Reserved