
File list
From AtlasWiki
This special page shows all uploaded files.
| Date | Name | Thumbnail | Size | Description | Versions |
|---|---|---|---|---|---|
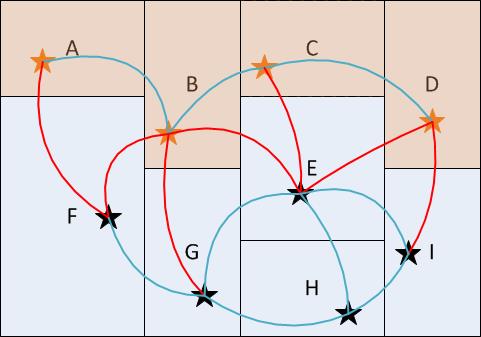
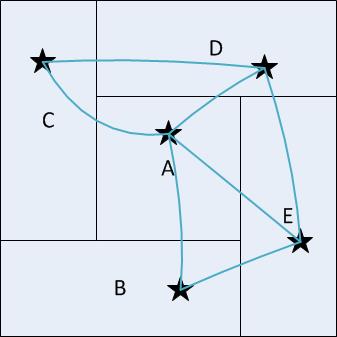
| 09:25, 5 June 2016 | Graph5H.jpg (file) |  |
14 KB | Graph for Connect5H | 1 |
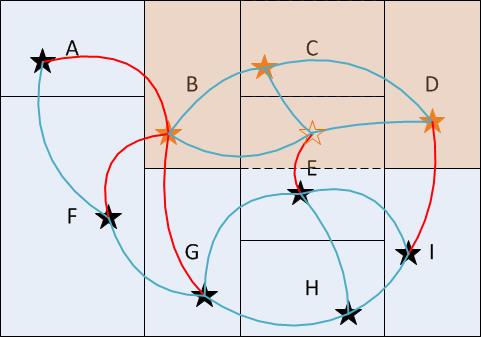
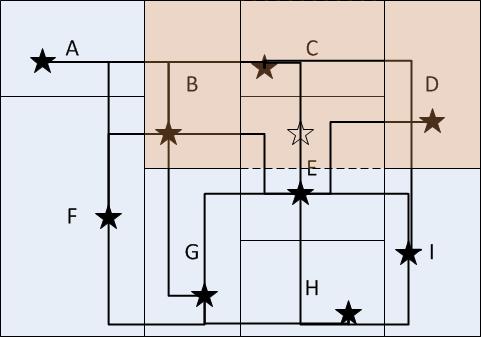
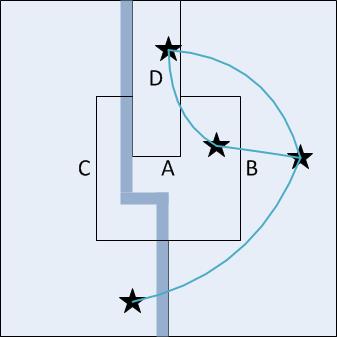
| 09:25, 5 June 2016 | Connect5H.jpg (file) |  |
14 KB | Bridge chop for a nick path - regionally connected | 1 |
| 09:24, 5 June 2016 | Graph5G.jpg (file) |  |
13 KB | Graph for Connect5G | 1 |
| 09:23, 5 June 2016 | Connect5G.jpg (file) |  |
14 KB | Bridge chop for a nick path - not regionally connected | 1 |
| 09:22, 5 June 2016 | Graph5F.jpg (file) |  |
12 KB | Graph for Connect5F | 1 |
| 09:20, 5 June 2016 | Connect5F.jpg (file) |  |
14 KB | Bridge chop used to connect two components | 1 |
| 11:02, 2 June 2016 | Graph5E.jpg (file) |  |
13 KB | Graph for Connect5E | 1 |
| 11:01, 2 June 2016 | Connect5E.jpg (file) |  |
13 KB | Illustration of nick path | 1 |
| 07:34, 27 May 2016 | Graph9B.jpg (file) |  |
19 KB | Graph for Connect9B | 1 |
| 07:33, 27 May 2016 | Graph9A.jpg (file) |  |
19 KB | Graph for Connect9A | 1 |
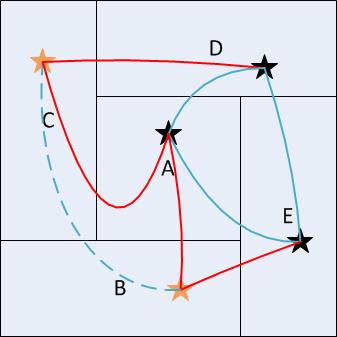
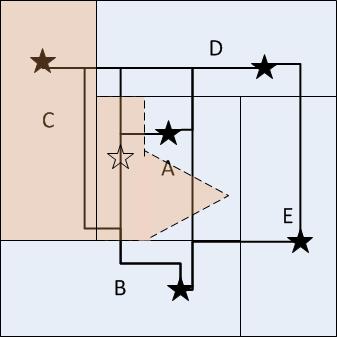
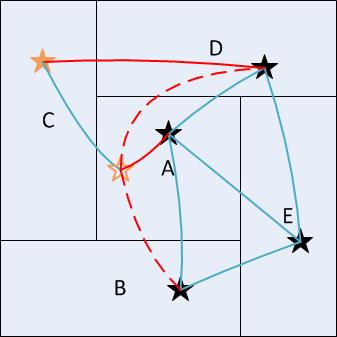
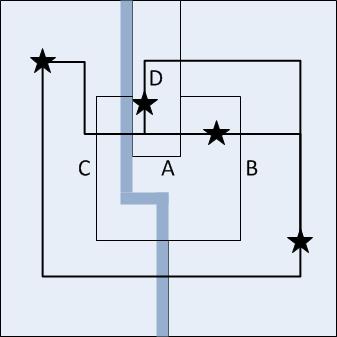
| 12:35, 18 May 2016 | Graph5D.jpg (file) |  |
15 KB | Applied new rules. Local connects with links are dashed. | 2 |
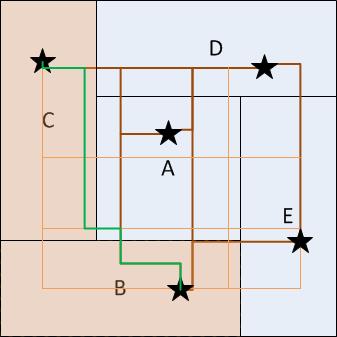
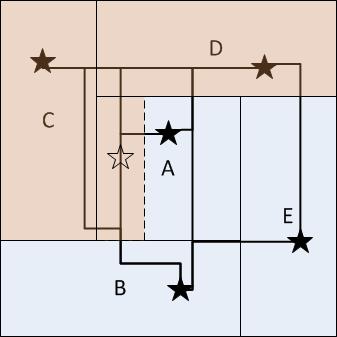
| 12:31, 18 May 2016 | Connect5D.jpg (file) |  |
15 KB | Added local roads | 2 |
| 08:32, 24 April 2016 | Graph4B.jpg (file) |  |
12 KB | Graph of Connect4B showing links to the isolated fragment. | 1 |
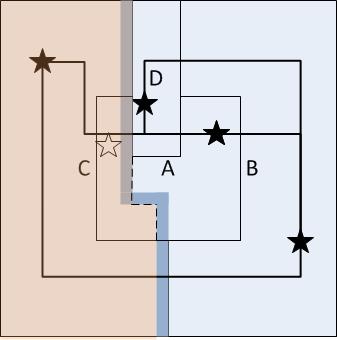
| 08:31, 24 April 2016 | Connect4B.jpg (file) |  |
12 KB | Chop creating an isolated fragment. | 1 |
| 08:48, 1 April 2016 | Connect9B.jpg (file) |  |
17 KB | Illustration of erosity reducing chops - one chop | 1 |
| 08:47, 1 April 2016 | Connect9A.jpg (file) |  |
17 KB | Illustration of erosity reducing chops - no chop | 1 |
| 08:50, 31 March 2016 | Connect5C.jpg (file) |  |
12 KB | Reverted to version as of 12:39, 31 March 2016 | 6 |
| 08:41, 31 March 2016 | Graph5C.jpg (file) |  |
12 KB | Match new connect5C | 2 |
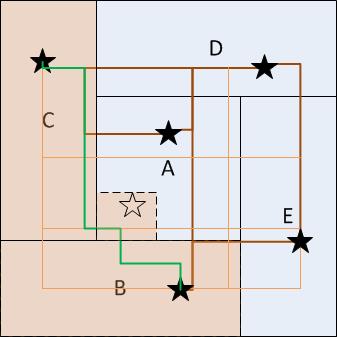
| 23:54, 29 March 2016 | Connect5B.jpg (file) |  |
11 KB | Add node for fragment. | 2 |
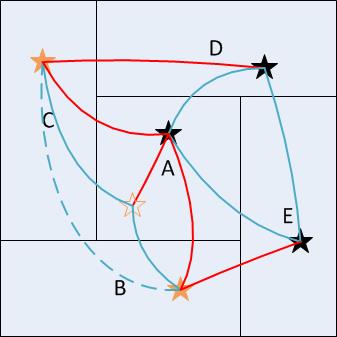
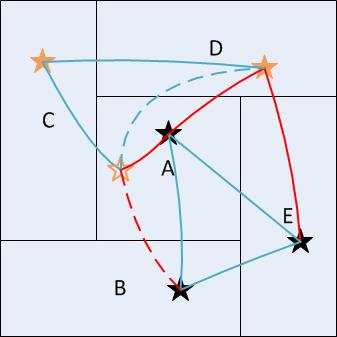
| 13:15, 21 March 2016 | Graph5B.jpg (file) |  |
12 KB | Graph for Connect5B. The colored stars indicate nodes in the shaded district. The outlined star is the node created by the chop. The red lines are links between nodes in different districts. The dashed lines are links created by secondary paths. | 1 |
| 09:27, 21 March 2016 | Graph4A.jpg (file) |  |
10 KB | Equivalent graph for connect4A. | 1 |
| 09:25, 21 March 2016 | Graph5A.jpg (file) |  |
11 KB | Equivalent graph for Connect5A. | 1 |
| 09:23, 21 March 2016 | Connect4A.jpg (file) |  |
11 KB | Example of connections between 4 geographic units. A natural barrier is shown by the grey shaded area. Nodes are indicated by stars. Roads are indicated by heavy lines. | 1 |
| 09:21, 21 March 2016 | Connect5A.jpg (file) |  |
11 KB | Example of connections between 5 geographic units. Nodes are indicated by stars. Roads are indicated by heavy lines. | 1 |
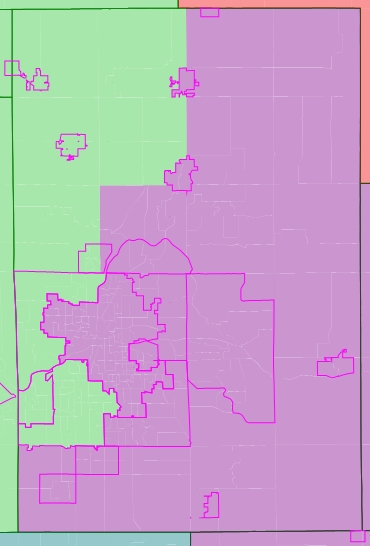
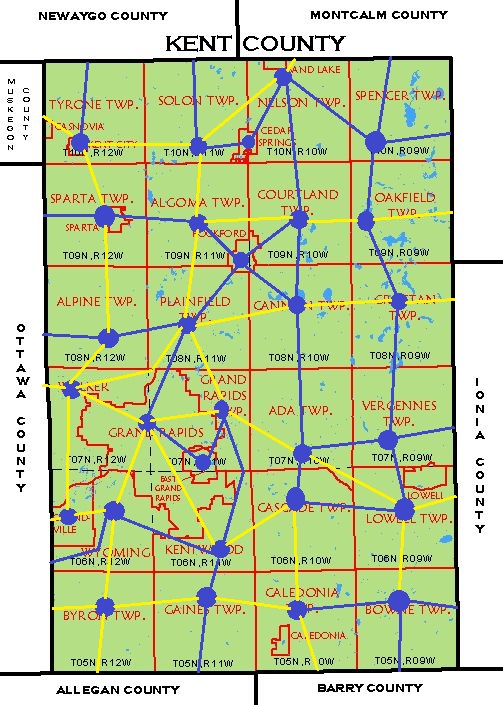
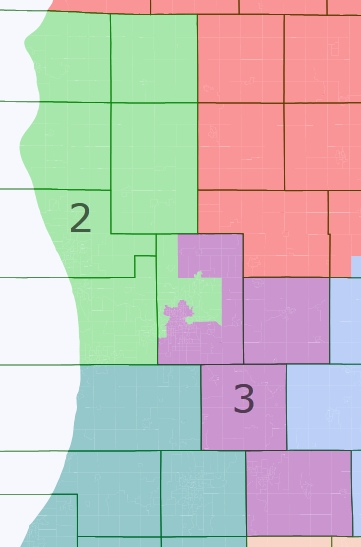
| 12:29, 29 January 2015 | MI Kent C.jpg (file) |  |
84 KB | Detail for MI west C | 1 |
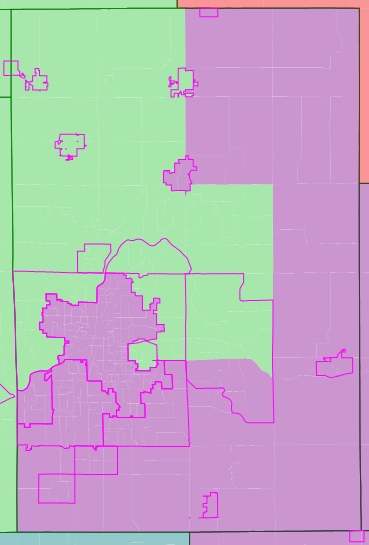
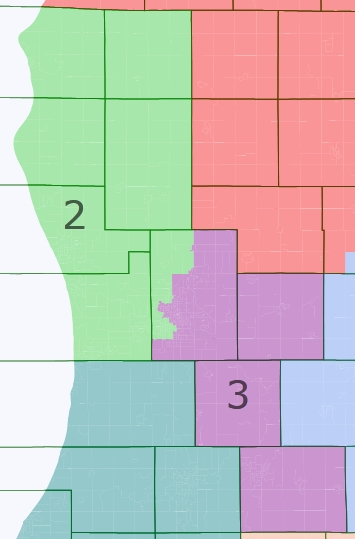
| 12:22, 29 January 2015 | MI Kent B.jpg (file) |  |
84 KB | Detail for MI west B | 1 |
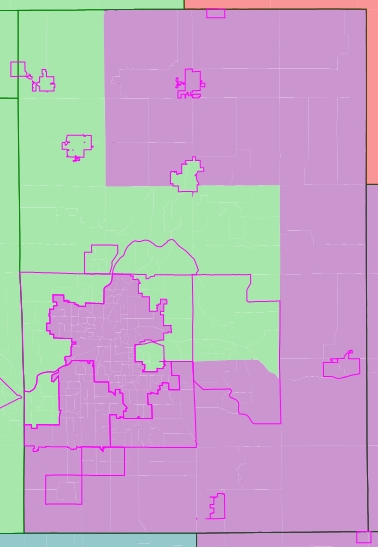
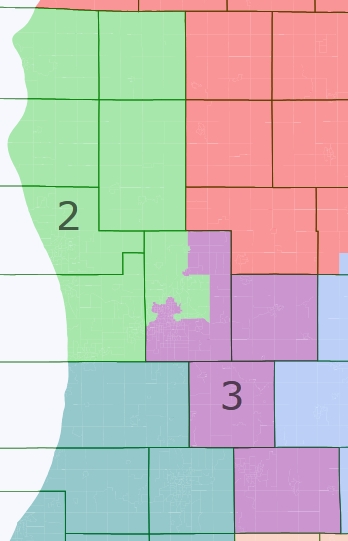
| 12:13, 29 January 2015 | MI Kent A.jpg (file) |  |
84 KB | Detail for MI west A. | 1 |
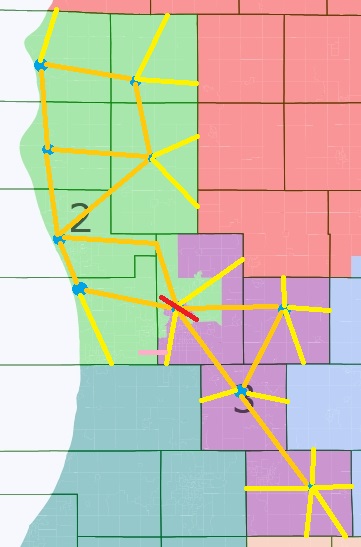
| 11:49, 29 January 2015 | Kent connect.jpg (file) |  |
159 KB | Connections between subunits of Kent. | 1 |
| 10:53, 29 January 2015 | MI west C.jpg (file) |  |
76 KB | Alternate to MI west A with a less erose chop. | 1 |
| 10:37, 29 January 2015 | MI west B.jpg (file) |  |
76 KB | Alternate version of MI west A with lower inequality. | 1 |
| 10:04, 29 January 2015 | MI west A connect.jpg (file) |  |
49 KB | MI west A plan showing county connections. | 1 |
| 09:48, 29 January 2015 | MI west A.jpg (file) |  |
76 KB | An example of two CDs in MI that together are made of whole counties, but chop one county. | 1 |
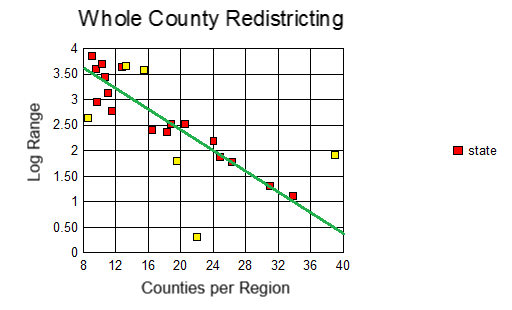
| 00:24, 13 June 2013 | Range vs Counties.png (file) |  |
18 KB | States redistricted for 2010 CDs using whole counties (or equivalent) with range less than 1% of a CD. Graph compares the logarithm of the range to the average number of counties per CD. The yellow points were excluded from the final fit represented by th | 1 |
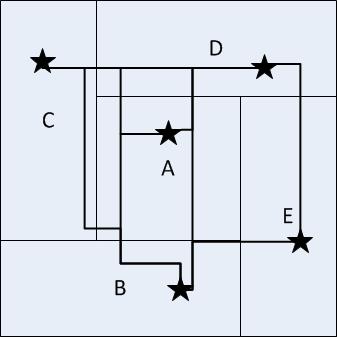
| 20:33, 27 May 2013 | Chops3AB.png (file) |  |
12 KB | Examples with three districts and five geographic units including one large geographic unit. Units A and C are 50% of a district, units B and D are 40% of a district, and unit E is 120% of a district. | 1 |
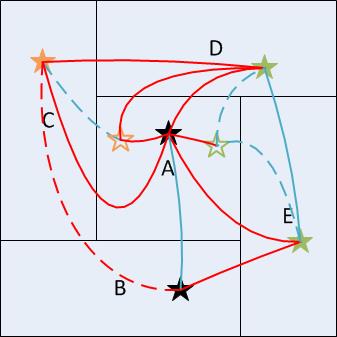
| 09:43, 23 May 2013 | Chops5DE.png (file) |  |
16 KB | Two plans with equal county (A-E) chops but different city (circle) chops. | 1 |
| 23:38, 20 May 2013 | Chops5C.png (file) |  |
6 KB | Five county example the chops spread among three counties. | 1 |
| 23:31, 20 May 2013 | Chops5B.png (file) |  |
10 KB | Five county example with all chops in one county. | 1 |
| 23:22, 20 May 2013 | Chops5A.png (file) |  |
6 KB | Five artificial counties to show chops. | 1 |