


Note: The Google advertisement links below may advocate political positions that this site does not endorse.
|
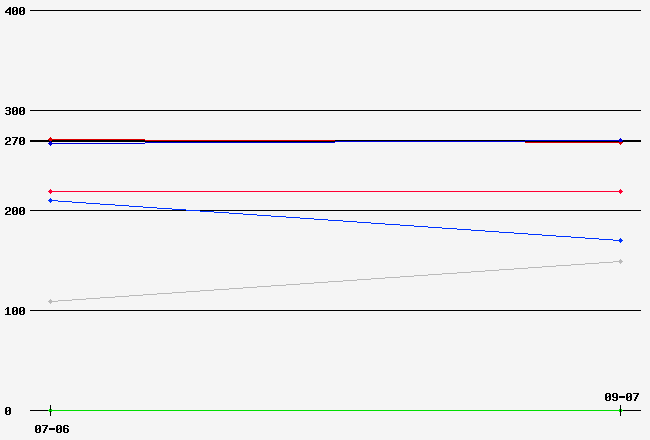
Date of Prediction: 2023-09-07 Version:2
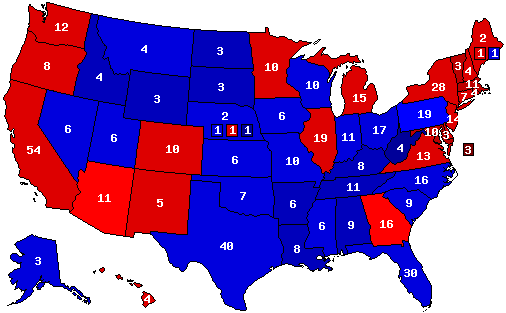
Prediction Map
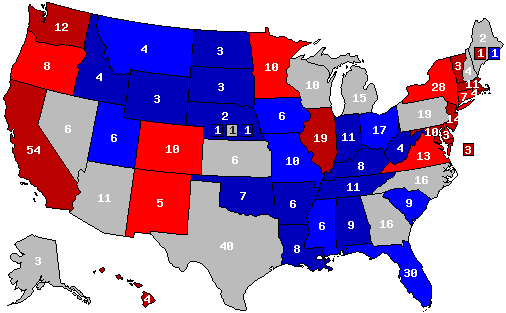
Confidence Map
Prediction States Won
Confidence States Won
State Pick-ups
Analysis
Trump popular vote win with a large gain in working class voters of color. Election hinges on turnout by voters of color in Georgia, Pennsylvania, Wisconsin, and Nevada. Nevada is the tipping point state.
Prediction History
Comments History
- show
Version History Member Comments User's Predictions
Links
|
|||||||||||||||||||||||||||||||||||||||||||||||||||||||||||||||||||||||||||||||||||||||||||||||||||||||||||||||||||||||||||||||||||||||||||||||||||||||||||||||||||||||||||||||||||||||||||||||||||||||||||||||||||||||||||||||||||||||||||||||||||||||||||||||||||||||||||||||||||||||||||||||||||||||||||||||||||||||||||||||||||||||||||||||||||||||||||||||||||||||||||||
 2024 President
 2022 Senate
 2020 President
 2020 Senate
 2016 President
 2016 Senate
 2016 Governor
 2012 President
 2012 Senate
 2012 Rep Primary
 2010 Senate
 2010 Governor
 2009 Governor
 2008 President
 2008 Senate
 2008 Governor
 2008 Dem Primary
 2008 Rep Primary
 2007 Governor
 2006 U.S. Senate
 2006 Governor
 2004 President


Back to 2024 Presidential Prediction Home - Predictions Home
© Dave Leip's Atlas of U.S. Elections, LLC 2019 All Rights Reserved