PredictionsEndorse2018 Gubernatorial Election Polls - OH ResultsPolls
Note: The Google advertisement links below may advocate political positions that this site does not endorse.
Ohio Polls (Aggregate = Tossup for 3-poll average)National Summary
Candidate Party Avg. #Wins Poll Graph
Richard Cordray Democratic 48% 2pie
Mike DeWine^ Republican 45% 0
Other - 5% 0
-Undecided- 3% 1

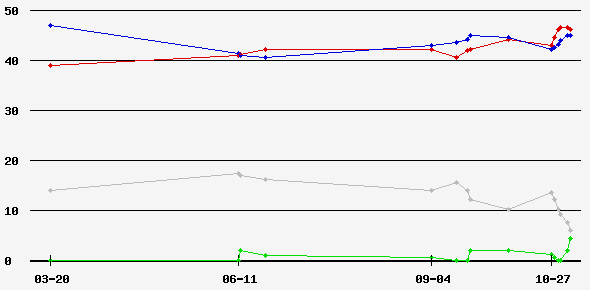
 Three-Poll Rolling Average
 Rolling Average Poll Graph

DatePoll Source Spread Rep Dem IndUnd M.O.E. Sample#C
2018-11-04 Change ResearchD +543%48%6%3%4%923 L13
2018-11-04Trafalgar GroupD +442%46%7%5%2%1,948 L9
2018-11-03Research ConsultantsTie49%49%2%0%4%405 L1
2018-10-31CygnalTie43%43%0%14%4%503 L12
2018-10-30Gravis MarketingD +543%48%0%9%4%789 L6
2018-10-28Emerson CollegeD +346%49%0%5%4%566 L12
2018-10-27Other SourceD +141%42%0%17%4%1,051 L5
2018-10-08Other SourceR +242%40%0%18%4%1,017 L14
2018-10-08Suffolk UniversityD +640%46%3%11%4%500 L23
2018-09-21IpsosR +145%44%2%9%3%1,074 L5
2018-09-20Other SourceR +549%44%0%7%3%1,003 L24
2018-09-20Marist CollegeTie47%47%0%6%5%564 L15
2018-09-15Other SourceR +542%37%0%21%4%1,048 L
2018-09-04Other SourceTie43%43%0%14%3%822 L13
2018-06-23Marist CollegeR +446%42%0%12%3%1,000 R
2018-06-12Quinnipiac UniversityD +240%42%2%16%4%1,082 L30
2018-06-11Suffolk UniversityD +736%43%0%21%4%500 L14
2018-03-20Survey USAR +847%39%0%14%4%1,408 R31


Back to 2018 Gubernatorial Polls Home - Polls Home


Terms of Use - DCMA Policy - Privacy Policy and Cookies

© Dave Leip's Atlas of U.S. Elections, LLC 2019 All Rights Reserved