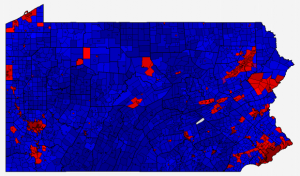
Pennsylvania 2012 Presidential Election Result Map by Municipality
The Pennsylvania 2012 presidential election results map by Municipality (City, Borough, Township) is now complete. Mitt Romney and Paul Ryan won a total of 2,031 municipalities while Barack Obama and Joe Biden won in 524 (11 were ties). This is a pickup for the Republican ticket vs. 2008, of 234 municipalities. Similar to many other states, the municipalities with the largest number of votes cast voted overwhelmingly Democratic, with Obama/Biden winning all of the top ten (Philadelphia, Pittsburgh, Allentown, Upper Darby, Erie, Lower Merion, Abington, Haverford, Scranton, and Millcreek) with a net margin of 656,882 votes. The bulk of the margin votes are from the city of Philadelphia where Obama received 85.2% of the vote, resulting in a margin of 492,339 votes. Romney’s largest margin in any municipality is 6,714 votes in Hampfield Township in Westmoreland County. The total aggregated margin in all 2,031 municipalities won by Romney is 696,033, slightly more than the Obama margin in the ten municipalities listed above. Full details, including party and swing maps can be viewed on the Pennsylvania 2012 Town page. The forum topic is located here.
For members, there are now available county township maps on the individual county results pages. In addition, the same maps and data are now available for President in the general elections of 2000, 2004, and 2008.
The 2012 Presidential Election Results map for Minnesota by county subdivision (City, Township, UT) is now complete. Mitt Romney and Paul Ryan won a total of 1,864 cities and townships while Barack Obama and Joe Biden won in 825 (37 were ties). This is a pickup for the Republican ticket vs. 2008, of 200 cities and towns. Similar to many other states, the municipalities with the largest populations voted overwhelmingly Democratic, with Obama/Biden winning nine of the top ten (Minneapolis, St. Paul, Rochester, Bloomington, Duluth, Plymouth, Eagan, Brooklyn Park, and Woodbury; Romney won Maple Grove) with a net margin of 258,206 votes. The state-wide margin of all 2,726 cities and townships is Democratic +225,942 votes. In the city of Minneapolis alone, Obama/Biden won 80.3% to 16.6%, a margin of 136,920 votes. Full details can be viewed on the Minnesota 2012 Town page. The forum topic is located here.
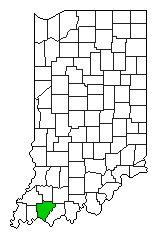
The updated 2012 general election results for Warrick County, IN have been released by the Warrick County Election Office. On March 3, 2014, it was announced that thousands of ballots were not reported in the 2012 general election due to error. The new report includes the addition of 3,790 absentee ballots omitted from the original report. However, the new report omits one military ballot and four provisional ballots (the four provisional ballots were counted in the original report). For President, the outstanding ballots are statistically similar to the ballots originally counted, with a nearly identical percentage for Romney, a slightly higher percentage for Obama, and only half the percentage for Johnson. The table below shows the comparison:
Warrick County, IN Ballot Comparison
Candidate
Original
Audited
Change
% Change
Total Ballots
24,984
28,770
3,786
15.2%
Mitt Romney
15,351
17,680
2,329
15.2%
Barack Obama
8,793
10,181
1,388
15.8%
Gary Johnson
486
523
37
7.6%
All online databases and store files for US President, US Senate, Governor, and US House of Representatives have been updated to reflect this update.
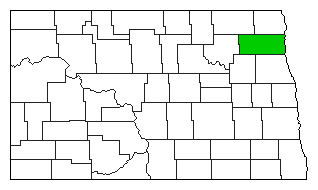
Walsh County, ND data for 2012 have been updated on the atlas to reflect the recanvass of the results by the County Auditor in April, 2013. The Auditor said that there were insufficient ballots printed for the 2012 General Election, and to accommodate the voters, photocopies were made and then hand counted. This resulted in some confusion and the results were recanvassed in April of 2013. The net result was a small decrease in the official totals across all offices and all candidates. Romney’s net vote dropped by 157 from 2,813 to 2,656 and Obama lost 139 votes from 2,124 to 1,985. Similar vote reductions occurred for candidates for U.S. Senate, U.S. House of Representative, and Governor.
The Warrick County, Indiana Clerk has recently announced a discovery that 3,791 early ballots cast in the 2012 General Election were left uncounted in the official results published. Looking at the data, a comparison of the ballots cast in 2008 and 2012 show an overall decline in total ballots cast of 4,211 (29,195 ballots were cast in 2008 vs 24,984 cast in 2012 – a decline of 14%). This compares with a 4.6% decline in overall turnout state-wide. More strikingly, the total number of absentee ballots dropped from 10,372 to 1,981 or 81%! Another anomaly shows that the number of machine ballots increased to 22,999 from 18,823, an increase of 4,176 votes (22% increase). These data compare with the county voter registration increase of 3,367 voters (+7.2%), causing the overall turnout to fall from 62.5% to 49.9%. The table below summarizes the data:
Ballots
2008
2012
Change
Machine
18,823
22,999
4,176
+22.2%
Absentee
10,372
1,981
-8,391
-80.9%
Total
29,195
24,984
-4,211
-14.4%
Reg Voters
46,718
50,085
3,367
+7.2%
Turnout
62.5%
49.9%
-12.6%
The turnout of 49.9% voter turnout ranks Warrick fourth from the bottom (89th place), just ahead of Clinton, Switzerland, and Scott. In 2008, Warrick was right in the middle of the pack (40th place). Below is a chart that shows the Warrick County normalized voter turnout from 1980 to 2012 (vs. Registered Voters). This is calculated by subtracting the statewide voter turnout from the voter turnout in Warrick County.
Warrick County, IN Normalized Turnout
The chart highlights the significant decline in normalized turnout for 2012, well outside the normal variable range for the county, pointing to a high probability of an error. Thus far, the Warrick County Clerk has not published an update to the official county vote results for the 2012 General Election. The Atlas will be updated when this occurs. Thanks to Jeff Singer for the tip.
The New Republic has published an article titled “The Mysterious Town That Voted For Ron Paul” based on the Election Atlas Maine statewide township map of the 2012 General Election results for President (it links to this weblog post). The Atlas has a weblog entry on this very topic published back on June 28, 2013. The New Republic article expresses some concern on the validity of the result based on the lack of lack of existing modern information about Concord Unorganized Township on the web and the absence of election results from Concord UT in recent elections. As for the latter concern, there is recent evidence of consistent results reported from Concord UT. In addition to the three votes cast for President in 2012 from (all write-ins for Ron Paul), there are also three votes cast for U.S. Senate, U.S. House of Representatives District 2, State Senate District 26, and State Representative District 88. Furthermore, while 2012 was the first modern year that Maine published Presidential Election results separately for Concord UT, the Maine 2010 General Election results as published by the Maine Bureau of Corporations, Elections & Commissions also include three votes for Governor from Concord UT (two for Republican Paul LePage and one for Independent Eliot Cutler) as well as three votes each for U.S. Representative, State Senator, and State Representative. Another mention of Concord UT separately is a voter registration report from November of 2006 that includes five registered voters (four Unenrolled and one Republican). Earlier reports of election results mention that Concord UT results are included with Solon Township (example: General Election Tabulations November 2, 2004).
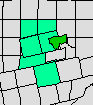
Elections Administered by Millinocket
A number of the gray-shaded towns in the Maine statewide township map have residents, but not governments that administer elections. Rather, larger surrounding townships administer elections in the unorganized townships and include these votes in their tallies. One example is that of Millinocket (dark green in map at right), where the town administers elections in Penobscot Unorganized Townships 3 and 4, Long A UT, Cedar Lake UT, T1 R9 WELS UT, and T1 R8 WELS UT (all in light green). Sometimes, the election results or voter registration figures for these outlying unorganized townships are tallied separately, sometimes they are added to the votes cast within the administering township, and sometimes they are reported as an aggregate separate from the administering township. Results vary from year to year.
The Colorado Office of the Secretary of State publishes a biennial report of official election results for the several elections held in the preceding two years. Often the results presented within this abstract differ from the on-line reports published on the agency website shortly after the election. The 2012 Abstract of Votes Cast has only small deviations in the votes for Saguache County relative to the results published in the January 2012 on-line report. The differences are Barack Obama (D) +1, Roseanne Barr (P&F) +2, Anderson (Jus) -2, Tittle (WTP) +1, Miller (ATP) -1. The Atlas database has been updated with this minor change. Full results of the Colorado 2012 General Election Results for President are available on the Atlas here.
The Illinois State Board of Elections did not count one 2012 General Election Presidential Ballot vote for Barack Obama in the City of Aurora. In the state of Illinois, the administration of elections is performed by a combination of county governments and a number of city election commissions. The final set of results, however, published by the Illinois State Board of Elections, is summarized only by County. An oversight within this process is evident in the 2012 General Election Results for the City of Aurora. Aurora is split between four counties – Kane, Kendall, Will, and DuPage. The Aurora Election Commission administers the precincts residing in three of these counties (the DuPage County Election Commission administers those precincts entirely within its boundaries because a county commission supersedes a city commission, whereas a city commission supersedes a county clerk). The precinct-level results from Aurora City are tallied by county and the totals are included with the results of Kane, Kendall, and Will, as appropriate. However, the 2012 Statement of Votes Cast from the Aurora Election Commission, includes an entry labeled “Presidential Ballot”, with one vote cast for Barack Obama. This ballot was not allocated to its home precinct. When the tallies of the votes for President were made, the data suggest that only the physical precinct votes were tallied by county and included in the Official Vote. This “Presidential Ballot” appears not to have a defined county, leaving it left uncounted. The table below shows a detailed breakdown of the official results for Barack Obama for the counties of Kane, Kendall, and Will, showing the one vote discrepancy:
The 2012 General Election results for President officially reported in the West Virginia Certificate of Ascertainment include a total of 229 votes cast for 26 declared write-in candidates. The vote data for the write-in candidates are not included by the West Virginia Secretary of State in their online election results database. To date, the Election Atlas database only had the statewide totals available, including 119 votes for Virgil Goode, 31 votes for Roseanne Barr, 12 votes for Rocky Anderson, etc. Recently, I received the full county-level data for these candidates from the West Virginia Secretary of State’s office and incorporated them into the atlas.
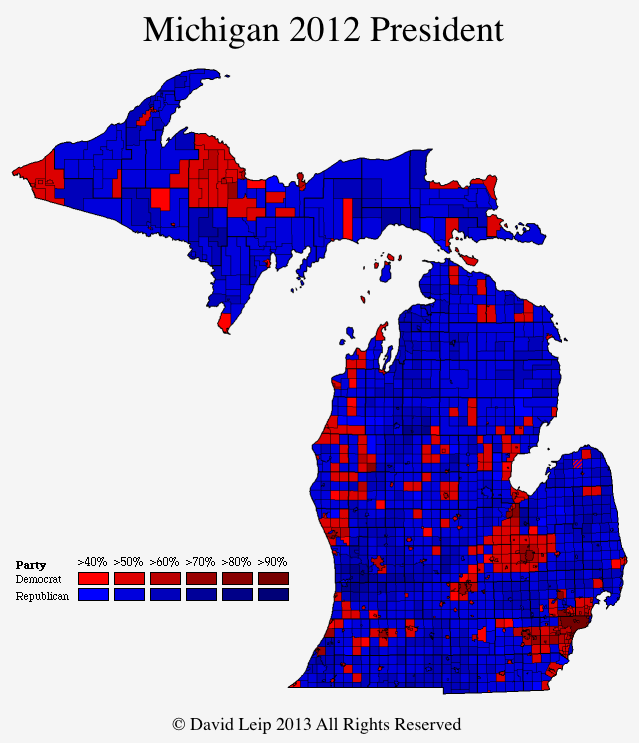
The 2012 Presidential Election Results map for Michigan by county subdivision (City, Township, and Charter Township) is now complete. Mitt Romney and Paul Ryan won a total of 1,133 cities and townships while Barack Obama and Joe Biden won in 382 (eight were ties). This is a significant number of pickups for the Republican ticket vs. 2008, where Obama and Biden won in 684 cities and townships vs. the McCain/Palin ticket’s 830. Similar to many other states, the municipalities with the largest populations voted overwhelmingly Democratic, with Obama/Biden winning nine of the top ten (Detroit, Grand Rapids, Warren, Ann Arbor, Sterling Heights, Clinton, Lansing, Canton, Farmington Hills; Romney won Livonia) with a net margin of 385,875 votes. In the city of Detroit alone, Obama/Biden won 97.6% to 2.1%, a margin of 275,724 votes. Full details can be viewed on the Michigan 2012 Town page.