 Michigan County Map Highlighting Saginaw County The official results posted by the Michigan Secretary of State for the 2016 Republican Presidential Primary includes a 3,000 vote error for Ted Cruz in Saginaw County. The Saginaw County Clerk posted the official Summary results showing Ted Cruz with 6,535 votes (3,966 votes in the 4th congressional district and 2,569 votes in the 5th congressional district). The county-level file posted by the Michigan Secretary of State shows the total figure for Saginaw County as 3,535 -> 3,000 votes less than the totals reported by the county. A review of the precinct report suggests the county figure is the correct one. The figures on the Atlas reflect this correction. The 2016 Michigan Presidential Primary Republican results can be seen here. Note that the error is not significant enough to change the delegate allocation.
 Kansas County Map Highlighting Shawnee County There exists a significant vote error in the 2004 general election result for United States Senate in Shawnee County, KS as published in the 2004 November 2nd General Election Official Results by County posted by the Kansas Secretary of State. The totals are shown in the table below:
| Candidate | Party | Vote | Percentage |
| Samuel Brownback | Republican | 36,895 | 67.7% |
| Lee Jones | Democratic | 15,297 | 29.2% |
| Steven Rosile | Libertarian | 1,010 | 1.9% |
| George Cook | Reform | 698 | 1.3% |
The total votes counted in the above table is 54,530 and is significantly lower than the 81,577 votes counted for President, 80,582 votes counted for U.S. House of Representatives, and 82,784 ballots cast. The drop-off is 33% relative to the Presidential Vote. The reason for this drop-off is because the figures for U.S. Senate as published by the Kansas Secretary of State are incorrect. The vote totals as published in the Statement of Votes Cast by the Shawnee County Election Office show the correct figures, repeated below:
| Candidate | Party | Vote | Percentage |
| Samuel Brownback | Republican | 53,491 | 67.2% |
| Lee Jones | Democratic | 23,773 | 29.9% |
| Steven Rosile | Libertarian | 1,396 | 1.8% |
| George Cook | Reform | 980 | 1.2% |
The total error is 25,110 votes. The missing votes are actually very similar percentage wise to the counted votes and do not impact the results of the contest. The Atlas database has been updated with these corrected results and can be seen here:
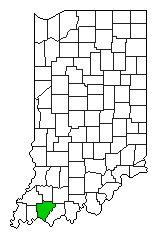
 Indiana County Map Highlighting Johnson County There exists a 1,000 vote data error in the official and final election results for Indiana United States Representative District 9 as published by the Indiana Secretary of State. The error is in the vote total for Libertarian candidate Ralph Mike Frey in Johnson County. The total tabulated by the Indiana Secretary of State of 1,930 votes is actually only 930 votes as confirmed by the Johnson County Clerk. The Johnson County report, General Election November 4, 2014 Summary Report, is final and official and deemed the accurate count. The 2014 U.S. House dataset has been updated with the correction.
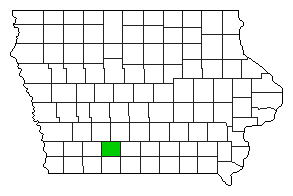 Iowa County Map Highlighting Union County The 2014 General Election official gubernatorial results published by the Iowa Secretary of State include a significant error in Union County, where 2,224 votes were not included in the statewide tally (52% of the total votes in Union County). Published results from the Union County Auditor show the correct figures. The table below compares the two: Union County, IA 2014 General Election Result for Governor
| Candidate | IA SoS Result | Union County Result | Difference |
| Total | 2,062 | 4,286 | -2,224 |
| Terry Bradstad (R) | 1,388 | 2,690 | -1,302 |
| Jack Hatch (D) | 560 | 1,407 | -847 |
| Lee Deakins Hieb (L) | 68 | 105 | -37 |
| Others | 56 | 84 | -28 |
Interestingly, other statewide offices are correct, only the race for Governor is in error. The corrected data have been updated in the Atlas database (Union County Gubernatorial Result page).
The certified general election results for New York Representative in Congress as posted by the New York State Board of Elections on December 15, 2014 incorrectly swaps the data in Congressional District 11 between Richmond County and Kings County. The correct results are published in the Statement and Return Report for Certification by the New York City Board of Elections. While this error did not change the total vote count for any candidate, it skewed the results by county, incorrectly showing a Democratic win in Richmond County. The Atlas dataset for US Representative has been updated with this correction.
 Warrick County, IN The Warrick County, Indiana Clerk has recently announced a discovery that 3,791 early ballots cast in the 2012 General Election were left uncounted in the official results published. Looking at the data, a comparison of the ballots cast in 2008 and 2012 show an overall decline in total ballots cast of 4,211 (29,195 ballots were cast in 2008 vs 24,984 cast in 2012 – a decline of 14%). This compares with a 4.6% decline in overall turnout state-wide. More strikingly, the total number of absentee ballots dropped from 10,372 to 1,981 or 81%! Another anomaly shows that the number of machine ballots increased to 22,999 from 18,823, an increase of 4,176 votes (22% increase). These data compare with the county voter registration increase of 3,367 voters (+7.2%), causing the overall turnout to fall from 62.5% to 49.9%. The table below summarizes the data:
| Ballots | 2008 | 2012 | Change |
| Machine | 18,823 | 22,999 | 4,176 | +22.2% |
| Absentee | 10,372 | 1,981 | -8,391 | -80.9% |
| Total | 29,195 | 24,984 | -4,211 | -14.4% |
| Reg Voters | 46,718 | 50,085 | 3,367 | +7.2% |
| Turnout | 62.5% | 49.9% | -12.6% | |
The turnout of 49.9% voter turnout ranks Warrick fourth from the bottom (89th place), just ahead of Clinton, Switzerland, and Scott. In 2008, Warrick was right in the middle of the pack (40th place). Below is a chart that shows the Warrick County normalized voter turnout from 1980 to 2012 (vs. Registered Voters). This is calculated by subtracting the statewide voter turnout from the voter turnout in Warrick County.
Warrick County, IN Normalized Turnout
The chart highlights the significant decline in normalized turnout for 2012, well outside the normal variable range for the county, pointing to a high probability of an error. Thus far, the Warrick County Clerk has not published an update to the official county vote results for the 2012 General Election. The Atlas will be updated when this occurs. Thanks to Jeff Singer for the tip.
The Illinois State Board of Elections did not count one 2012 General Election Presidential Ballot vote for Barack Obama in the City of Aurora. In the state of Illinois, the administration of elections is performed by a combination of county governments and a number of city election commissions. The final set of results, however, published by the Illinois State Board of Elections, is summarized only by County. An oversight within this process is evident in the 2012 General Election Results for the City of Aurora. Aurora is split between four counties – Kane, Kendall, Will, and DuPage. The Aurora Election Commission administers the precincts residing in three of these counties (the DuPage County Election Commission administers those precincts entirely within its boundaries because a county commission supersedes a city commission, whereas a city commission supersedes a county clerk). The precinct-level results from Aurora City are tallied by county and the totals are included with the results of Kane, Kendall, and Will, as appropriate. However, the 2012 Statement of Votes Cast from the Aurora Election Commission, includes an entry labeled “Presidential Ballot”, with one vote cast for Barack Obama. This ballot was not allocated to its home precinct. When the tallies of the votes for President were made, the data suggest that only the physical precinct votes were tallied by county and included in the Official Vote. This “Presidential Ballot” appears not to have a defined county, leaving it left uncounted. The table below shows a detailed breakdown of the official results for Barack Obama for the counties of Kane, Kendall, and Will, showing the one vote discrepancy:
|
Aurora |
County Clerk |
Total |
IL SBoE |
√ |
| County |
# Prc |
Votes |
# Prc |
Votes |
|
| Kane |
63 |
20,304 |
228 |
70,028 |
90,332 |
90,332 |
√ |
| Kendall |
3 |
1,157 |
83 |
21,314 |
22,471 |
22,471 |
√ |
| Will |
7 |
2,493 |
304 |
141,736 |
144,229 |
144,229 |
√ |
| Total |
73 |
23,954 |
615 |
233,078 |
257,032 |
257,032 |
√ |
|
| Aurora City |
74 |
23,955 |
∆ of 1 |
|
|
|

 Middlesex County, MA The official general election results for Governor as published in the 2010 Public Document #43 Massachusetts Election Statistics (a book printed by the Massachusetts Secretary of the Commonwealth, with an online edition located here) contains an error in the City of Cambridge, Middlesex County. With 1,076 votes for “All Others” as a red flag, an investigation reveals that the PD#43 tabulation scrambled the results in Ward 5 Precinct 1 – where the published table has Democrat Deval Patrick with 1 vote, Republican Charlie Baker with 23, Independent Tim Cahill with 31, Green-Rainbow Jill Stein with 10, “All Others” with 1,054 and 108 blanks. The official result as published by the City of Cambridge has Deval Patrick with 1,054 votes, Charlie Baker with 108, Tim Cahill with 23, Jill Stein with 31, 10 Blank votes, and 1 write-in vote. The corrected totals as published from the City of Cambridge has been incorporated in the Election Atlas database, resulting in an increase in total vote for Deval Patrick of 1,053 votes, an increase of 85 votes for Charlie Baker, a decrease of 8 votes for Tim Cahill, an increase of 21 votes for Jill Stein, and a decrease of 1,053 votes for “All Others”.
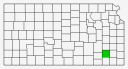 The 2012 General Election official Vote Totals as reported by the Kansas Secretary of State Elections & Legislative division includes results from Wilson County that are double-counted. Wilson County has a relatively small population of 9,409 as enumerated by the U.S. Census Bureau in 2010 (estimated population of July 2012 is 9,105) and is located east of Wichita and south of Topeka as shown in the map at right. The table below shows the officially reported results for President in Wilson County: The 2012 General Election official Vote Totals as reported by the Kansas Secretary of State Elections & Legislative division includes results from Wilson County that are double-counted. Wilson County has a relatively small population of 9,409 as enumerated by the U.S. Census Bureau in 2010 (estimated population of July 2012 is 9,105) and is located east of Wichita and south of Topeka as shown in the map at right. The table below shows the officially reported results for President in Wilson County:
| Official Reported |
|
Presidential Candidate |
Vice Presidential Candidate |
Political Party |
Popular Vote |
 |
Willard Mitt Romney |
Paul Ryan |
Republican |
5,650 |
76.00% |
 |
Barack H. Obama |
Joseph R. Biden, Jr. |
Democratic |
1,636 |
22.01% |
 |
Gary Johnson |
James P. Gray |
Libertarian |
94 |
1.26% |
|
Chuck Baldwin |
Joseph Martin |
Reform |
54 |
0.73% |
|
The sum of the votes cast for President as reported is 7,434. However, the Kansas 2012 General Election Official Turnout Report shows only 3,752 ballots cast and 5,845 registered voters in Wilson County. Furthermore, the total counted votes for President in 2008 was 4,121. Upon inspection of the 2012 Kansas General Election Results by Precinct, it becomes clear that the votes for each candidate are counted twice. The Atlas database has been updated to reflect the correct data.
|