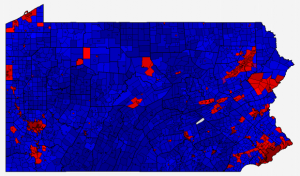
Pennsylvania 2012 Presidential Election Result Map by Municipality
The Pennsylvania 2012 presidential election results map by Municipality (City, Borough, Township) is now complete. Mitt Romney and Paul Ryan won a total of 2,031 municipalities while Barack Obama and Joe Biden won in 524 (11 were ties). This is a pickup for the Republican ticket vs. 2008, of 234 municipalities. Similar to many other states, the municipalities with the largest number of votes cast voted overwhelmingly Democratic, with Obama/Biden winning all of the top ten (Philadelphia, Pittsburgh, Allentown, Upper Darby, Erie, Lower Merion, Abington, Haverford, Scranton, and Millcreek) with a net margin of 656,882 votes. The bulk of the margin votes are from the city of Philadelphia where Obama received 85.2% of the vote, resulting in a margin of 492,339 votes. Romney’s largest margin in any municipality is 6,714 votes in Hampfield Township in Westmoreland County. The total aggregated margin in all 2,031 municipalities won by Romney is 696,033, slightly more than the Obama margin in the ten municipalities listed above. Full details, including party and swing maps can be viewed on the Pennsylvania 2012 Town page. The forum topic is located here.
For members, there are now available county township maps on the individual county results pages. In addition, the same maps and data are now available for President in the general elections of 2000, 2004, and 2008.
The 2012 Presidential Election Results map for Minnesota by county subdivision (City, Township, UT) is now complete. Mitt Romney and Paul Ryan won a total of 1,864 cities and townships while Barack Obama and Joe Biden won in 825 (37 were ties). This is a pickup for the Republican ticket vs. 2008, of 200 cities and towns. Similar to many other states, the municipalities with the largest populations voted overwhelmingly Democratic, with Obama/Biden winning nine of the top ten (Minneapolis, St. Paul, Rochester, Bloomington, Duluth, Plymouth, Eagan, Brooklyn Park, and Woodbury; Romney won Maple Grove) with a net margin of 258,206 votes. The state-wide margin of all 2,726 cities and townships is Democratic +225,942 votes. In the city of Minneapolis alone, Obama/Biden won 80.3% to 16.6%, a margin of 136,920 votes. Full details can be viewed on the Minnesota 2012 Town page. The forum topic is located here.
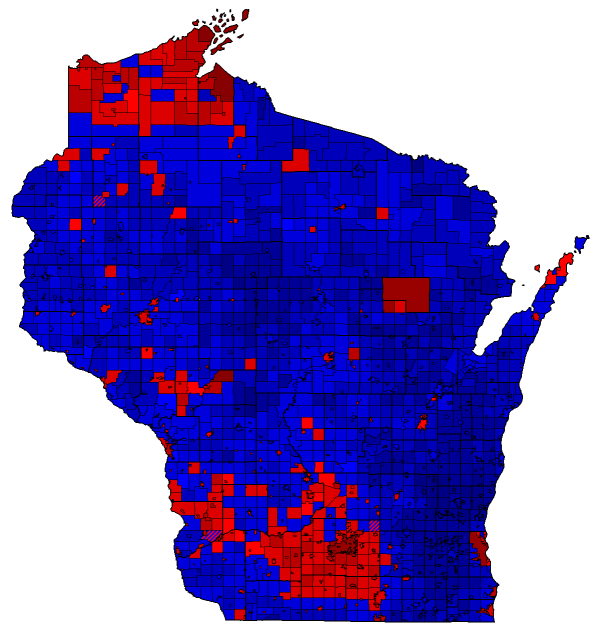
Wisconsin 2014 Gubernatorial Election Result Map by Municipality
The 2014 General Election result map for Governor in the state of Wisconsin tabulated by Municipality is complete (shown at right). The contest was between incumbent Republican Governor Scott Walker and Democratic candidate Mary Burke (results page). The final statewide percentages are almost an exact repeat of the 2010 contest between Scott Walker and Tom Barrett (results page). The 2014 result was Walker over Burke 52.26% to 46.59% and the 2010 result was Walker over Barrett 52.25% to 46.48%!
At the county and municipality level, the results are quite similar as well. Walker wins 1,508 municipalities with an average margin of 272 votes (median margin of 93 votes) to Burke’s 381 with an average margin of 715 votes and a median margin of 41 votes (the Democratic data are dominated by two municipalities – Milwaukee City with a margin of 109,679 and Madison City with a margin of 70,846). The largest Republican margin is in Brookfield City (Waukesha County) with 9,929 votes. Seven municipalities are ties. In 2010, Walker won 1,480 municipalities to Barrett’s 399 with 15 ties. The largest swings were in the north-central part of the state with Iron and Taylor Counties leading the Republican Swing percentage while the south and north-west portions of the state had Democratic Swings. Detailed maps are available here.
In the 2014 General Election contest for U.S. Senate in Alabama, more than 360,000 voters left their ballot blank. The race featured incumbent Senator Jeff Session running for re-election without a named opponent printed on the ballot. The ballot did include, however, an option to vote for a write-in a candidate. On November 24, the Alabama Secretary of State certified the 2014 General Election Results, publishing the final tally of the vote as 795,606 for Republican Jeff Sessions (97.25%) and 22,484 write-ins (2.75%). The county-level result, shown at right, is a solid “>90%” in every county, with exception of Macon County, where the write-in tally just cleared 10%. Full results are available here.
Looking deeper into the data though, its clear that most voters that did not want to vote for the incumbent Senator simply left their ballots blank.
Alabama 2014 US Senate Vote Dropoff
The drop-off vote from Governor to U.S. Senate (the difference in total vote between the two contests) is 362,323 votes (30.6%). The total Republican Vote for Jeff Sessions in the U.S. Senate contest is only 5.7% more than Republican Robert Bentley received in the Gubernatorial vote – 795,606 vs. 750,231, a difference of 43,375 – full Gubernatorial results can be seen here. At the county level, the drop-off varies considerably, from the smallest drop-off of 10.4% in Blount County to the largest of 80.5% in Greene County. A map of the results can be seen at right.
Map Key
>10%
>20%
>30%
>40%
>50%
>60%
>70%
>80%
Dropoff
Alabama 2014 Gubernatorial Vote for Republican
In one example, Macon County, Democratic Gubernatorial candidate Parker Griffith received 4,830 votes (85.3%) to Robert Bentley’s 829 (14.6%) and three write-in votes – a total of 5,662 votes. In the U.S. Senate contest, Jeff Sessions, picked up 1,133 votes to 127 write-ins. The number of blank votes in the U.S. Senate race relative to the Governor’s race 4,402 votes (77.8%).
Predictably, the drop-off correlates with the percentage of vote for Republican, as shown in the map to the right. The sharpness of the magnitude of this correlation may be, in part, due to the existence of the straight-party option. As seen in this sample ballot, the voter can choose Alabama Democratic Party, Alabama Independence Party, or Alabama Republican Party at the very top of the ballot under “Straight Party Voting”. If the voter chooses the “Alabama Democratic Party” option, no vote for US Senate is cast.
The residents of Shannon County, SD have voted to change the name of the county to Oglala Lakota County. The vote tally from the November 4th election is
Yes
2,161
80.4%
No
526
19.6%
The process has several more steps until the name change becomes official, including a joint resolution of the South Dakota Legislature followed by a proclamation from the governor. The name change then becomes official on the first day of the first month following the proclamation. South Dakota Statute 7-1-71 and Statute 7-1-72 state:
7-1-71. Legislative resolution to change name. The Governor at the next convention of the annual session of the State Legislature shall communicate the result of an election held pursuant to § 7-1-69 in such county to the presiding officer of each branch of the Legislature, and thereupon the Legislature shall designate by joint resolution the new name of such county.
7-1-72. Governor’s proclamation of new county name. Upon the designation made by the Legislature pursuant to § 7-1-71, the Governor shall publicly proclaim the result of the election held pursuant to § 7-1-69 and of the new name of the county. The new name of such county shall be in full force and effect on the first day of the month following such proclamation by the Governor.
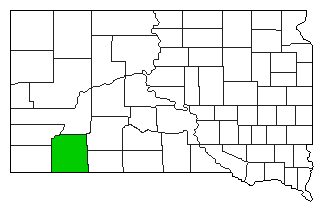
Shannon County Change of County Name Precinct Results Map
The vote for the “Shannon County Change of County Name” took place on the same day as the 2014 General Election, but on a separate paper ballot. A sample ballot with question wording may be seen here.
The map at the right shows the full Shannon County precinct result for the vote. All precincts voted in favor of the change except for Cuny Table, the precinct with the fewest votes in the northwest corner, where they voted against the change 22 to 19. Five precincts voted with more than 80% in favor.
Map Key
>50%
>60%
>70%
>80%
Yes
No
The map key is shown at the right. The table below show the precinct-level data from the vote.
Shannon County Name Change Precinct Results
Precinct Name
Yes Vote
No Vote
Yes %
No %
Total
2,161
526
80%
20%
Batesland
69
43
62%
38%
Cuny Table
19
22
46%
54%
Kyle
299
69
81%
19%
Manderson
150
27
85%
15%
Oglala
336
90
79%
21%
Pine Ridge 1
538
116
82%
18%
Pine Ridge 3
375
75
83%
17%
Porcupine
322
62
84%
16%
Rockyford
53
22
71%
29%
Shannon County was Barack Obama’s best county in the 2012 General Election (see statistics page), where he won with 93.4% of the vote. Mitt Romney only managed 6.0%. Full 2012 Shannon County presidential results are available here.
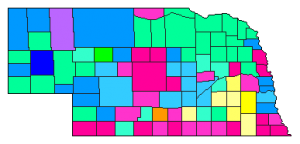
The Nebraska 2014 Republican Gubernatorial Primary was a competitive six-way contest with a very flat result. No candidate received more than 27% of the vote, four candidates received more than 19%, and every one of the six candidates won in at least one county. Omaha businessman Pete Ricketts came out on top with a preliminary unofficial total of 26.5% (57,922 votes), followed closely by Nebraska Attorney General Jon Bruning at 25.49% (55,751 votes), State Senator Beau McCoy at 20.94% (45,804 votes), and State Auditor Mike Foley with 19.22% (42,029 votes). Trailing were Tax attorney Bryan Slone with 4.13% and State Senator Tom Carlson with 3.74%. Across the state, only three counties were won with more than 40% of the vote – the top one being Phelps County won by fifth place finisher Carlson with 49.7% (his home town is Holdrege located in Phelps County), Ricketts won Morrill County (in the panhandle) with 42%, and Foley won Lancaster County with 41%. The table below summarizes the results:
The Pie chart at right is the statewide breakdown of the vote for the six candidates. Rickett’s strongest vote margins were in the Omaha area of Douglas and Sarpy Counties, where he had a combined margin advantage of 5,427 votes. Fourth-place finisher, Foley, had the highest-margin county in Lancaster, where he topped Bruning by 5,986 votes and Ricketts by 6,363 votes. However, he did not have sufficient state-wide support to achieve victory. Bruning’s support was more dispersed, winning the most counties, concentrated in the north and west, but not having any high-margin counties. McCoy is similar to Bruning, with his support concentrated in the central and southern portions of the state. Carlson and Slone both had more than 30% support in only a single county each. Below is a full interactive mouse-over map.
Polk County has the smallest win percentage, where Bruning won with 310 votes (24.12%) to 306 for Foley, 302 for Ricketts, 299 for McCoy, Carlson at 50, and Slone at 18. An almost even 4-way split! The full results page on the atlas is located here.
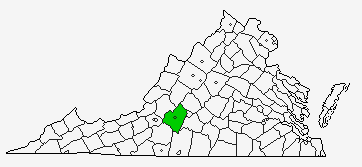
The 2013 general election map of Virginia includes the first county-equivalent boundary change since the independent city of Clifton Forge, VA reverted to a town in 2001. On July, 1, 2013, the independent city of Bedford, VA transitioned to town status, removing the boundary separating Bedford City from Bedford County. The number of independent cities in Virginia is now 38, with 95 counties, for a total of 133 county equivalents.
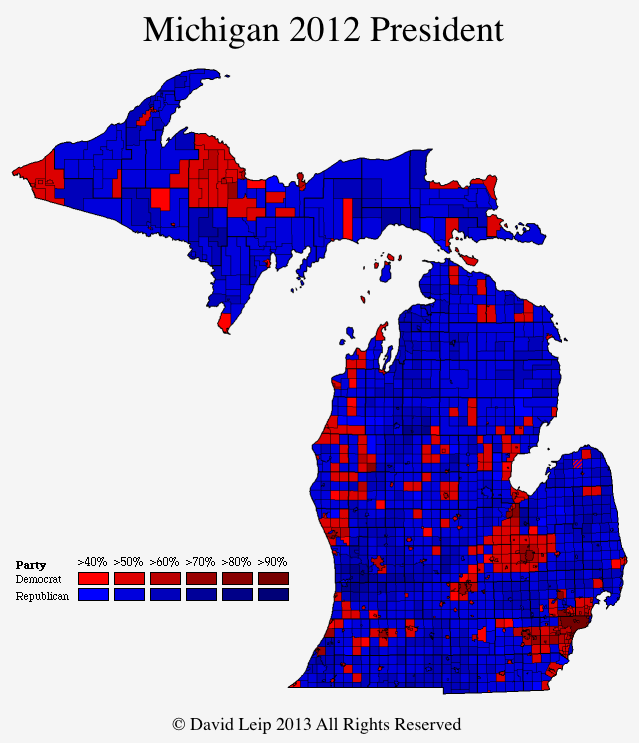
The 2012 Presidential Election Results map for Michigan by county subdivision (City, Township, and Charter Township) is now complete. Mitt Romney and Paul Ryan won a total of 1,133 cities and townships while Barack Obama and Joe Biden won in 382 (eight were ties). This is a significant number of pickups for the Republican ticket vs. 2008, where Obama and Biden won in 684 cities and townships vs. the McCain/Palin ticket’s 830. Similar to many other states, the municipalities with the largest populations voted overwhelmingly Democratic, with Obama/Biden winning nine of the top ten (Detroit, Grand Rapids, Warren, Ann Arbor, Sterling Heights, Clinton, Lansing, Canton, Farmington Hills; Romney won Livonia) with a net margin of 385,875 votes. In the city of Detroit alone, Obama/Biden won 97.6% to 2.1%, a margin of 275,724 votes. Full details can be viewed on the Michigan 2012 Town page.
An interesting map to have a look at is the Presidential Swing map by city and town for the state of Wisconsin in the 2012 general election. With Congressman Paul Ryan on as the Republican Vice Presidential candidates – a native representing Wisconsin’s first congressional district, does the map reflect a larger vote swing in his home district? The second map at right shows the 2012 Presidential Election Results by U.S. Congressional District. The first district is located in the southeast corner of the state – south and west of Milwaukee. The overall result in the first congressional district was Romney/Ryan 51.6%, Obama/Biden 47.4%, Others 1.1%. However, the swing map shows that the cities and towns within the first district are about average for the southern half of the state. Larger swings towards the Romney/Ryan ticket were recorded in the northern portion of the state, especially within the seventh and eighth districts. More detail on this can be viewed on the 2012 Wisconsin Presidential Election Results by City and Town page.
More county subdivision maps have been added to the site for Wisconsin general elections for President and are now complete for 2000, 2004, 2008, and 2012. New county subdivision maps include state-wide and individual county for winning vote percentage, party, swing, trend (swing and trend are not available for 2000). All of the new maps include the mouse-over pop-up feature and are clickable to open the results for that city or town.