The official general election results for Governor as published in the 2010 Public Document #43 Massachusetts Election Statistics (a book printed by the Massachusetts Secretary of the Commonwealth, with an online edition located here) contains an error in the City of Cambridge, Middlesex County. With 1,076 votes for “All Others” as a red flag, an investigation reveals that the PD#43 tabulation scrambled the results in Ward 5 Precinct 1 – where the published table has Democrat Deval Patrick with 1 vote, Republican Charlie Baker with 23, Independent Tim Cahill with 31, Green-Rainbow Jill Stein with 10, “All Others” with 1,054 and 108 blanks. The official result as published by the City of Cambridge has Deval Patrick with 1,054 votes, Charlie Baker with 108, Tim Cahill with 23, Jill Stein with 31, 10 Blank votes, and 1 write-in vote. The corrected totals as published from the City of Cambridge has been incorporated in the Election Atlas database, resulting in an increase in total vote for Deval Patrick of 1,053 votes, an increase of 85 votes for Charlie Baker, a decrease of 8 votes for Tim Cahill, an increase of 21 votes for Jill Stein, and a decrease of 1,053 votes for “All Others”.
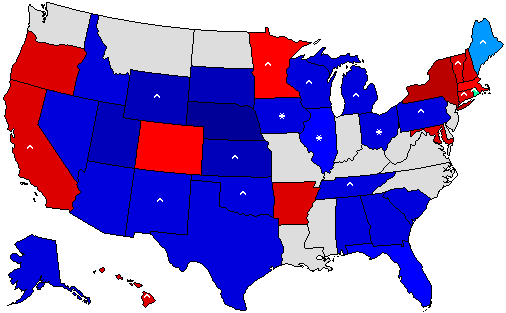
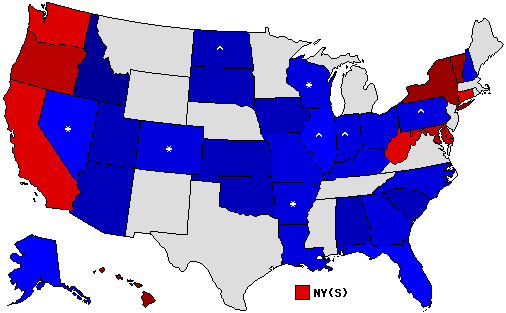
The Atlas 2010 General Election results for U.S. Senate and Governor have been updated to reflect several official changes in certified data. In Colorado, the official publication of the “Abstract of Votes Cast” (a printed book, but also available in a pdf version) includes higher figures relative to the Official Results report published on the Colorado Secretary of State’s web site on November 24, 2010 (over five thousand more votes are included in the published Abstract). In New York, the State Board of Elections published an Amended set of certified results on September 13, 2012. This report actually reduces the number of votes recorded in Westchester County. In Ohio, a slight increase in the vote count in Cuyahoga County is reflected by the most recent report on the Ohio Secretary of State 2010 General Election Official Results page. Lastly, 35 declared write-in votes are included for U.S. Senate in Delaware.
New County Subdivision maps have been added for New England States (Massachusetts, New Hampshire, Vermont, Maine, Connecticut, and Rhode Island) for the 2010 General Election contests for Governor. At right is the results for the three-way Gubernatorial contest in Maine – a close win by Republican Paul LePage over Independent candidate Eliot Cutler and Democratic candidate Libby Mitchell. LePage won with 38% of the vote to 36% for Cutler and 19% for Mitchell. LePage dominated the inland towns, while Cutler won in many of the coastal communities. Libby won in the far north and Native American townships.
A second three-way race in the 2010 General Election took place in Rhode Island, where Independent Lincoln Chafee won a three way contest against Republican candidate John Robitaille and Democratic candidate Frank Caprio. Chafee won with only 36% of the vote. Robitaille had 34% and Caprio received 23%. Chafee won the Providence area and south coast, Caprio took three communities north and west of Providence, while Robitaille won the North and West of the state.
The contests in both Connecticut and Vermont were very competitive – Democratic candidate Dan Malloy won in the Constitution State over Republican Tom Foley by a mere 6,404 votes (49.5% to 49.0%). In the Green Mountain State, Democrat Peter Shumlin won over Republican challenger Brian Dubie by 4,331 votes (49.5% to 47.7%).
In Massachusetts, Democratic incumbent Deval Patrick was reelected with a plurality of 48.4%. Republican Charlie Baker was second with 42%, Independent Tim Cahill had 8%, and Green-Rainbow candidate Jill Stein received 1.4%.
The only New England state to have a 2010 Gubernatorial winner with a majority of the vote was New Hampshire, where incumbent Democrat John Lynch won his third reelection bid – this time with a significantly smaller margin against Republican John Stephen (52.6% to 45.0%). Libertarian John Babiarz received 2.2%.
The 2010 Election Data has been updated – all states are now official. The last state to make public its detailed data is Massachusetts – where the official data by county is published in a the paper book called “Public Document #43 Massachusetts Election Statistics” – the document has just been released.
The 2010 Election Data has been updated – most states are now official. Exceptions are late results by county for Governor in Maine and Kansas as well as the Alaska Senate. In addition, several states do not certify their results for Governor until January (these include Texas, Tennessee, and Iowa). Massachusetts official data by county will not be available until some time in the spring after they publish the paper copy of “Public Document #43”.
The first update to the 2010 election results on the site as well as the data files are now available. Official results have been posted for a few states that certify their elections within a week. Other states have been updated to reflect continuing accumulation of absentee ballots.
Preliminary 2010 General Election data spreadsheets by county for U.S. Senate and Governor are now available for purchase on the store page. These data are incomplete and may contain inaccuracies at this stage. The files will continue to be updated as official results are certified – the last state to do so is California on December 8. As always, updates for purchased files are free.
Another exciting election has now passed – after a long night and very long day of compiling and uploading results, the web-based data, maps, and charts for the 2010 General Election for U.S. Senate and Governor are mostly uploaded. There are a number of states where county-level data are not yet available from their respective election agencies. Not all states are at 100% reporting level as yet and will be updated in the next few days. An incomplete, preliminary version of the data files will likely be available on the store page tomorrow.
Election Day 2010. Get out today and vote! (if you haven’t done so already). Here in the City of Newton, my voting location is in the Elementary School – and it was quite busy. Of course, its an active time as parents are dropping off their children on the way to work (there are no busses for elementary schools in Newton). The voting technology in the precinct is a paper ballot with ovals to be filled by black marker and inserted into an optical scan machine – a technology they have been using here for many years now. The counter on the machine read 245 as of about 8:30am (with 11 1/2 hours of voting to go). In the 2008 general election, the precinct had over 1,400 ballots cast and about 1,100 in the 2006 general election – will be interesting to see whether the intensity of this midterm drives the turnout closer to 2008 or remains closer to that of 2006. In addition to the Gubernatorial contest, there is also a competitive House race for the first time in years. Enjoy the day.
General Election 2010 Predictions and Endorsements close on Tuesday, November 2 at 3pm Eastern time. Be sure to get your updates in prior to that time.


 Election Day 2010. Get out today and vote! (if you haven’t done so already). Here in the City of Newton, my voting location is in the Elementary School – and it was quite busy. Of course, its an active time as parents are dropping off their children on the way to work (there are no busses for elementary schools in Newton). The voting technology in the precinct is a