


Individual Maine county township maps for the 2008 and 2012 General Elections for President have been created. These include swing, trend, and party maps with full mouse-over image maps. The maps are a result of the recent work to build an election mapping database for Maine to include the unincorporated townships missing from the US Census county subdivision database.
Category Archives: Election 2008
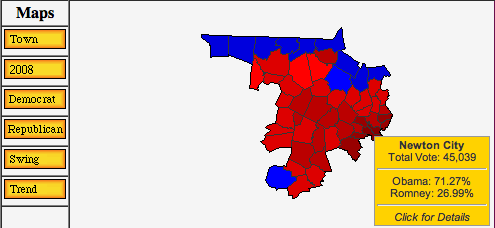
Enhanced County Township Maps
The Atlas is in the process of upgrading the county township maps in the members section. Going beyond the previous flat vote result map, the new maps are enhanced and greatly expanded, including an image-map to highlight the name of the city/town and the summary result in a pop-up window, include mouse-over maps/links for party, swing, trend, and the previous vote result. In addition, the maps are also larger. Currently, these new maps and features are available for President in 2012 and 2008 in New Hampshire, Vermont, Massachusetts, Connecticut, New York, Rhode Island, as well as brand new maps for New Jersey. I’m currently in the process of creating the Maine maps – an endeavor that is taking quite some effort due to the large mismatch between the available census maps and the township entities that are included in the Maine official results. Future expansion of this feature is planned to include more states, more offices, and more elections further back in time.
2008 Town Data Update
2008 General Election data for President by city and town have been added for the states of Michigan, Illinois, Pennsylvania, Ohio, New Jersey, Kansas, and a partial set from Indiana. These data are not fully reconciled with official totals. However, there are a lot of good matching data for most of the counties in these states. Statewide township maps and individual county township maps (Michigan and Illinois) will be forthcoming.
Washington 2008 Precinct Map
The map at the right shows a small version of the statewide results in Washington of the 2008 General Election for President by precinct (Obama in Red, McCain in Blue). This was made possible because the Washington Secretary of State has posted all the precinct-level GIS shape files. Most of the shape files line up with the county precinct data (although there are a number of discrepancies). The map link to the right brings you to the forum topic discussion on the 2008 Presidential Results by Precinct in Washington. The maps provide a very detailed geographic breakdown of the results, clearly showing the urban-rural split that has developed between the Republican and Democratic regions of support. Additional tweaking of the map is planned to incorporate the closest match to precinct boundaries used in the 2008 General Election for several counties.
2008 Data Files – Updates and New Voter Turnout
The 2008 data files for US President, US Senate, US House of Representatives, and Governors have been updated – these mostly include updates to Massachusetts – which only recently released “Public Document #43 – Massachusetts Election Statistics” – the only official data to the city and town level. The files also include several corrections to the official data discovered during compilation of precinct returns. These files are available for immediate download on your myatlas page (for previously purchased files.
A new 2008 voter registration and turnout file is also now available on the store page.
New York Township Map 2008
The 2008 New York Presidential General Election township map is now complete. . The precinct data was collected by contacting each of the 57 (non-New York City) Counties individually. The precinct data was aggregated by City and Town to produce this map.
Obama was victorious in 372 cities and towns to McCain’s 623 (there were two ties). However, Obama’s 372 victories were in places of considerably higher population – those 372 cities and towns cast 5,961,925 votes for Presidential Candidates, whereas in McCain’s 623 cities, and towns, a far less 1,679,564 votes were cast.
Relative to 2004, Obama increased Democratic victories by 154 (a 70% increase), many of the Republican-to-Democratic flips were in Upstate suburbs, the North Country (Northern Adirondacks and Quebec border), and in the Catskill region. Three towns flipped from Kerry to McCain (Throop (Cayuga), Brant (Erie), and Sangerfield (Oneida)).
2008 Data Files Updated
The 2008 General Election data files for President, Senate, Governor, and *New* U.S. House of Representatives have been updated to official results for all states except for Massachusetts. After repeated contacts through the internet and phone, I went in person to the Elections Office at the Secretary of the Commonwealth here in Boston, only to be told the same answer. They will not release any town or county election figures until the publication of Public Document #43, due out sometime later this year (they said perhaps as early as April).
The Presidential data set includes additional figures for write-in votes in multiple states that are not included in the official documents or reports published by the state agencies, rather I’ve been collecting these data from individual county reports. These data will continue to be updated and added to throughout the coming months.
As mentioned above, also available is a data set for U.S. House of Representatives, including data by congressional district and votes by party by county. Additional House data sets for previous years (back to 2000) are being compiled and will be available soon.
Preliminary 2008 Presidential Data File
A preliminary version of the 2008 County and New England Township data file is available on the store page. This file will be updated in the coming days/weeks as the data from the many states become official. The 2008 Senate and Gubernatorial files will also be available soon. As always, purchases of preliminary data are eligible for free updates.
Vote!
 Today is Election Day 2008! If you haven’t already done so, be sure to get to the polls and cast your ballot! Myself, having moved yet again, find myself in my fifth different voting precinct in the City of Newton – now in W3P2 (FYI, I’ve been in W2P1, W1P1, W2P2, W7P2, and now in W3P3). Once again, the ballots are optical scan ovals (I prefer this balloting technology – paper trail with fast computer high-accuracy scanning). The precinct location is at the Peirce Elementary School – with all the action I have come to expect – the place is active with the children attending class, the bake sale, and the citizens packing into the gymnasium to vote. There were more people in line this year relative to my past experience (Massachusetts, not being a swing state, doesn’t usually attract quite the crowds that are reported in states that are more competitive). Voting went off without a hitch. So, make your way to the polls!
Predictions, Endorsements, & Mock Election
Predictions, Endorsements, and the Mock Election will wrap-up at 4pm on Election Day (Eastern Standard Time). Please complete your updates by then as the scripts will be closed. And for those of you whom are eligible, don’t forget to cast your real ballots (if you haven’t already done so)