


Election predictions for the 2016 General Election are now open (U.S. President, U.S. Senate, and Governor). To help with picking winners, the polling database for the 2016 General Elections is also active. In 2012, the Atlas predictions for U.S. President had 81 users correctly call all 51 state-wide contests and all five congressional districts. The 2014 predictions were a bit tougher with nine users calling all states for U.S. Senate. Nobody called all 36 contests for Governor, given surprises in Maryland, Kansas, and Illinois. Good luck in this round!
Category Archives: New Feature
Upgraded Interactive Data Tables
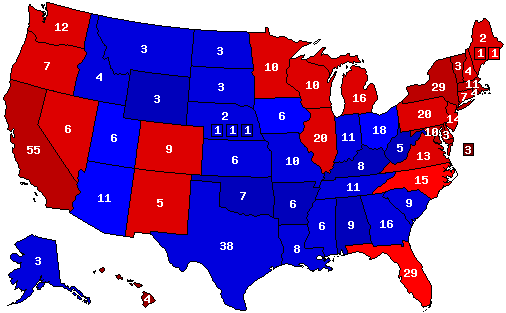
The data tables on the Atlas have been upgraded to provide more interactive features, including immediate multi-column sort, column filters, map highlights, and more. An interactive example of the 2012 Gubernatorial Election result is shown below:
New Features:
- Sort the table on a given column directly by clicking the arrows in the header row cell (one click, sorts ascending, two clicks sorts descending, third click removes the sort).
- Sort on multiple columns by holding down shift key when clicking on the header sort cell.
- Mouse over on a row highlights the row and the corresponding shape boundary on the map.
- Mouse over on a map highlights the shape boundary and the corresponding row in the table
- Click on the mini map at left of each row goes to the summary data page with candidate result details and maps.
- Click on the name at left of each row goes to the next-level down data table
New CSV Download for Election Data Spreadsheets
Purchased spreadsheet files from the Dave Leip’s Election Atlas store now include a new option to download county-level comma-separated value (csv) files that include the FIPS codes, county names, total vote, and vote data from each party/candidate – for the entire nation in one text-based file. These new files are currently available by county for all general election vote results data sets for U.S. Senate, U.S. Representative, Governor. The csv files are also available for general elections for President back to 1936. The csv and Excel versions of any purchased files may be downloaded on your myatlas page.
2013 Gubernatorial Endorsements Now Active
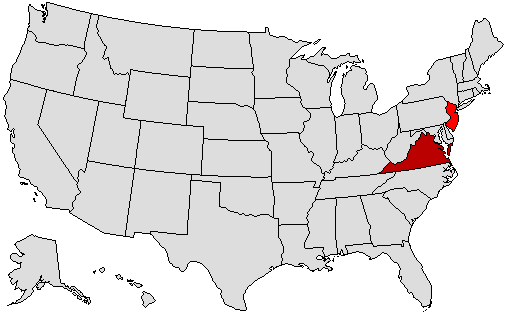 The 2013 Gubernatorial Endorsements are now active. There are only two contests this year – New Jersey and Virginia in which to share your preference.
Previous Election Map Button Added for Governor and US Senate
New maps have been added to the Gubernatorial and US Senate state summary pages – the mouse-over buttons to the left of the county results map now include one linking a map for the previous general election result, providing the same functionality to compare the result to the previous election that already exists for the Presidential state-level county maps.
New Statewide County Subdivision Maps
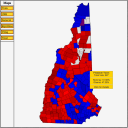 The Atlas has incorporated a new map set – statewide city and town maps (county subdivision) for New England states (plus NY and NJ for some Presidential Elections). Currently, maps are available for President 1992-2012 and Governor in some contests from 1990-2012, with more on the way. These statewide maps include mouse-over map buttons for party, swing, trend, and last election result (same function as available on the county map pages). In addition, these statewide maps include image-maps with a pop-up box that shows the city or town name plus the high-level election result. Clicking on a city or town opens the results page for that county subdivision. The 2012 maps are available to members and non-members alike, but due to the high-data content of these pages, older election maps are currently limited to the members section.
New Election Statistics Tables
The statistics page for each Presidential, US Senatorial, and Gubernatorial Election have been updated to include a new set of eight tables. Four of these highlight the states and counties with the largest swings from the previous election (both in raw votes and percentages). Additional tables also present states and counties with the largest change in total votes cast for the office (both as raw votes and percentages) to highlight some of the fastest growing and shrinking counties or the level of enthusiasm from election to election. An example swing percentage table from the 2012 Presidential Statistics is shown below:
States with Largest Vote Swing Percentage
| Republican | Democratic | ||
| Utah | 19.87% | Alaska | 7.55% |
| West Virginia | 13.65% | New Jersey | 2.21% |
| Montana | 11.26% | Mississippi | 1.68% |
| Indiana | 11.21% | Louisiana | 1.42% |
| North Dakota | 10.97% | New York | 1.32% |
The New Atlas Activity Stream
A new feature on the Atlas is a microblogging style activity stream. This page shows the latest updates in the 2012 General Election features – including new election poll entries, new and updated election predictions, new and updated endorsements, and votes and endorsements for President in the mock election. See the latest forum community activity.
New Predictions Available for 2012 Governor and U.S. Senate
The 2012 user-interactive prediction pages for Governor and for U.S. Senate are now available. See all the predictions on the Prediction Summary Page or all the 2012 features on the 2012 Summary Page
Automated Updates Via Email
The Atlas has a new feature to provide site updates via email with a new option on your myatlas page. Such updates include notifications when purchased election data files have been updated, the availability of new predictions, endorsements, or data files, as well as reminders when membership is about to expire. By default all paid membership accounts and Purchaser accounts are set to receive email updates and all free user accounts are set to not receive updates.