The Presidential Predictions for the 2020 General Presidential Election are now open at this link. Provide prediction and confidence maps with analysis for the upcoming general Presidential Election. Compare with other users’ predictions and follow the expectations trend as the campaign progresses.
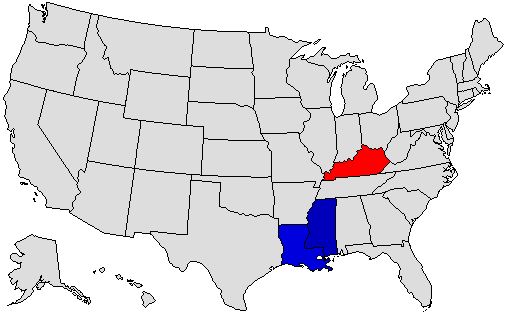
The 2015 Gubernatorial predictions for the general election to be held on November 3, 2015 are now active. Three states hold elections for their top executive office in 2015, Kentucky, Mississippi, and Louisiana. Add your prognostication here.
The data sets for US House of Representative, US Senate, and Governor have been updated to version 1.0 and are available on the store page. Updates are, of course, free for those whom have already purchased these files. The update may be downloaded from your myatlas page. This update includes:
Amended official results plus write-in votes in West Virginia
New data from Texas to correct the absence of Bailey County, and error in Kinney County
Corrected the error in the official results for Johnson County, Indiana
The Atlas User Endorsements feature for 2014 U.S. Senate and Governor are now active. Create a map for your favorite candidates for U.S. Senate and Governor in the 2014 General Election.
The Six Californias Initiative is in the news for having submitted signatures for a ballot measure to split the state of California into six smaller states. How would such a dramatic change have impacted the 2012 General Election for President?
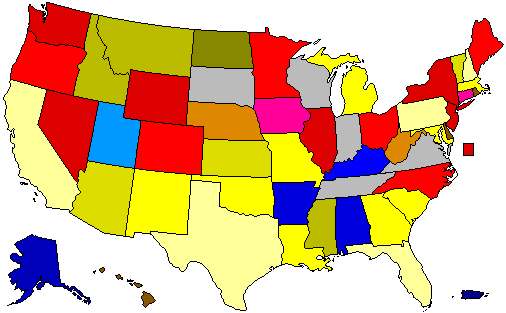
Six Californias Initiative Map
The proposed states are defined as follows: Jefferson (red), consisting of 14 counties in the north of the state to the Oregon Border, North California (gold) consisting of 13 counties running north of San Francisco to Lake Tahoe, Silicon Valley (green) consisting of eight counties from Contra Costa to Monterey, Central California (cyan) consisting of 14 counties north of Los Angeles and south of Sacramento, West California consisting of the four counties of Los Angeles, Ventura, San Luis Obispo, and Santa Barbara, and South California (magenta) consisting of the five counties in the southern part of the state south and east of Los Angeles.
To determine the number of Presidential Electors for the six new states, the representatives apportioned to each state is calculated using the Method of Equal Proportions based on the population figures from the 2010 U.S. Census. Jefferson would become the seventh smallest state with more population than Delaware but less than Montana any have only one representative. North California would have five, Silicon Valley nine, Central California six, West California 16, and South California 15. The combined number of representatives of the six Californias is 52, one fewer than the whole of California today. The one representative lost by the “Californias” is picked up by North Carolina. However, the six Californias would pick up 10 new U. S. Senators, for a total of 64 electoral votes in all (nine more than the current 55 electoral votes). The table below shows the breakdown of the total representatives and electoral votes for the proposed states, assuming that the size of the House of Representatives remains at 435.
Proposed State
Population (2010)
Rep
Sen
EV
Jefferson
949,240
1
2
3
North California
3,742,229
5
2
7
Silicon Valley
6,597,332
9
2
11
Central California
4,124,776
6
2
8
West California
11,335,455
16
2
18
South California
10,504,924
15
2
17
The Presidential Election results for these six states are quite interesting. Three of the states – Jefferson, Central California, and South California – are competitive with a margin of victory less than 3.5%. Romney wins Jefferson and Central California, while Obama wins the remaining four. The table below shows the data.
Proposed State
Total Vote
Margin
%
%O
%R
Vote Obama
Vote Romney
Jefferson
381,322
12,347
3.2%
46.0%
49.3%
175,551
187,898
N. California
1,536,378
289,964
18.9%
57.9%
39.0%
889,742
599,778
Silicon Valley
2,590,814
1,295,981
50.0%
73.5%
23.5%
1,904,135
608,154
C. California
1,147,447
31,011
2.7%
47.3%
50.0%
542,933
573,994
W. California
3,798,630
1,385,355
36.5%
67.0%
30.5%
2,543,219
1,157,864
S. California
3,601,224
86,385
2.4%
50.0%
47.6%
1,798,705
1,712,320
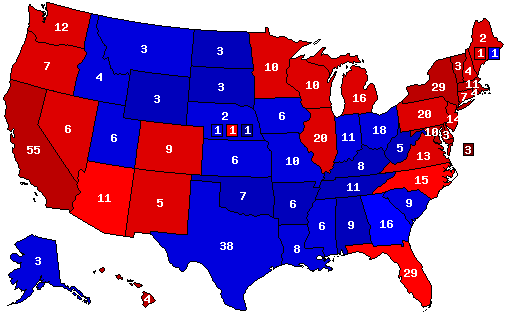
The electoral vote breakdown from the six Californias is 11 for Romney and 53 for Obama, with an additional one vote for Romney picked up in North Carolina due to the apportionment of one more representative to North Carolina as mentioned above. The overall electoral vote total is: Obama 330 to Romney 218. The national electoral vote map for this scenario is shown below:
The Atlas 2012 Mock Presidential Election and endorsement is now available. Cast your ballot for any of the 26 candidates that have ballot access in at least one state, choose “None of these Candidates”, or write-in your own candidate. The map compiles the results from Atlas members by state.
The 2012 Presidential Predictions for the General Election are now available. Get a jump on the 2012 election season with some presidential prognostications and enjoy.
The 2010 General Election endorsements for U.S. Senate and Governor are open for use. Choose whom you consider to be the best candidates for the job in all Senate and Gubernatorial contests.


 The Atlas 2012
 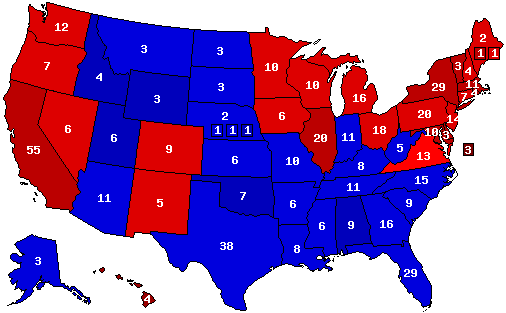 The 2012 Presidential Predictions for the General Election are