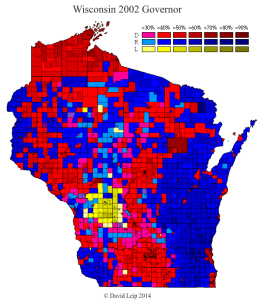
 Wisconsin 2002 Gubernatorial Election Result Map by Municipality At right is the Wisconsin 2002 General Election Result map for Governor by municipality. This contest was between incumbent Republican Governor Scott McCallum (whom assumed office when Governor Tommy Thompson resigned to become the U.S. Secretary of Health and Human Services in January of 2001), the Democratic candidate Attorney General Jim Doyle, the Libertarian Mayor of Tomah Ed Thompson (the younger brother of former Governor Tommy Thompson), the Green party candidate Jim Young, and several other minor party candidates. The statewide results of the election are summarized in the table below (full statewide results available here):
Wisconsin 2002 General Election Result for Governor
| | Gubernatorial
Candidate | Lt. Gubernatorial Candidate | Political Party | Popular Vote | % |
 | James Doyle | Barbara Lawton | Democratic | 800,515 | 45.09% |
 | Scott McCallum | Margaret Farrow | Republican | 734,779 | 41.39% |
 | A. Ed Thompson | Martin Reynolds | Libertarian | 185,455 | 10.45% |
| James Young | Jeff Peterson | WI Green | 44,111 | 2.48% |
| Others | - | - | 10,489 | 0.59% |
The results show an even split in the number of municipalities carried by Republican Scott McCallum and Democrat James Doyle. Doyle won 896 municipalities, with strong showing in the City of Milwaukee, Dane County through the central part of the state and in the Northwest counties of Douglas, Bayfield, and Ashland. Scott McCallum won in 905 municipalities, showing strength in the east of the state, from the Milwaukee western suburbs, north and east through the Eastern Ridges and Lowlands. Libertarian Candidate Ed Thompson won 72 municipalities, mostly centered around his home City of Tomah (where he won Monroe County as well as neighboring Juneau County). The overall margin of victory for James Doyle was 65,736 votes – fewer than his 93,126 vote margin in just two municipalities – Milwaukee, where he won 65.8% to 26.4% over his Republican Challenger, a margin of 55,420 votes and in Madison, where he won 62.8% to 18.8% (with 10.5% for Ed Thompson), a margin of 37,706 votes.
The candidates’ best counties with more than 1,000 votes are
- Doyle: Superior (Douglas County) with 68.2% to 23.4% for McCallum and 4.5% for Thompson
- McCallum: Oostburg (Sheboygan County) with 75.9% to 24.14% for Doyle and 5.15% for Thompson
- Thompson: Tomah (Monroe County) with 55.8% to 22.4% for Doyle and 20.4% for McCallum
More information and maps are available on the Atlas town map page for the 2002 Gubernatorial Results – Wisconsin. Atlas Forum topic on this result is located here.
The 2013 New Jersey General Election Gubernatorial Results are now official – posted by the New Jersey Division of Elections in the document Official List Candidates for Governor For General Election 11/05/2013 Election on December 4, 2013. The final results are Republican Chris Christie 1,278,932 (60.2%), Democrat Barbara Buono 809,978 (38.2%), Libertarian Kenneth R. Kaplan 12,155 (0.57%), Green Party candidate Steven Welzer 8,295 (0.4%) and four other minor party candidates with a combined total of 11,506 votes (0.54%). The margin of victory is 466,714 votes (22.2%). The Election Atlas also includes in its tally 2,175 write-in votes collected from individual county election reports that are not included in the “Official List” document.
Overall, the result is a solid Republican win for the incumbent in a heavily Democratic state. The last time a Republican won the race for Governor in New Jersey by such a large margin was by Thomas H. Kean in 1985. In 2013, Christie won all but two counties (falling short in Essex and Gloucester) – picking up six more counties relative to his win in 2009 on the back of an 18.6% swing statewide. His strongest showing was in Ocean County (75.7%) and had his largest swing in Hudson County (32.3%) although still coming up short of winning the county by 11.1%. The total votes counted in 2013 are 2,106,377 – a significant drop from 2009, where 2,425,441 votes were tallied (a drop of 319,064). Christie received 95,208 more votes vs. his run in 2009 while Buono received 284,792 fewer votes in 2013 than Jon S. Corzine did on the Democratic ticket in 2009. Full results are available for exploration here.
 Middlesex County, MA The official general election results for Governor as published in the 2010 Public Document #43 Massachusetts Election Statistics (a book printed by the Massachusetts Secretary of the Commonwealth, with an online edition located here) contains an error in the City of Cambridge, Middlesex County. With 1,076 votes for “All Others” as a red flag, an investigation reveals that the PD#43 tabulation scrambled the results in Ward 5 Precinct 1 – where the published table has Democrat Deval Patrick with 1 vote, Republican Charlie Baker with 23, Independent Tim Cahill with 31, Green-Rainbow Jill Stein with 10, “All Others” with 1,054 and 108 blanks. The official result as published by the City of Cambridge has Deval Patrick with 1,054 votes, Charlie Baker with 108, Tim Cahill with 23, Jill Stein with 31, 10 Blank votes, and 1 write-in vote. The corrected totals as published from the City of Cambridge has been incorporated in the Election Atlas database, resulting in an increase in total vote for Deval Patrick of 1,053 votes, an increase of 85 votes for Charlie Baker, a decrease of 8 votes for Tim Cahill, an increase of 21 votes for Jill Stein, and a decrease of 1,053 votes for “All Others”.
|


