


Pennsylvania 2012 Presidential Election Result Map by Municipality
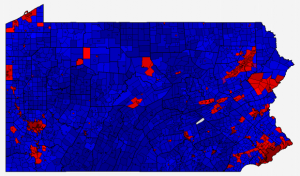
The Pennsylvania 2012 presidential election results map by Municipality (City, Borough, Township) is now complete. Mitt Romney and Paul Ryan won a total of 2,031 municipalities while Barack Obama and Joe Biden won in 524 (11 were ties). This is a pickup for the Republican ticket vs. 2008, of 234 municipalities. Similar to many other states, the municipalities with the largest number of votes cast voted overwhelmingly Democratic, with Obama/Biden winning all of the top ten (Philadelphia, Pittsburgh, Allentown, Upper Darby, Erie, Lower Merion, Abington, Haverford, Scranton, and Millcreek) with a net margin of 656,882 votes. The bulk of the margin votes are from the city of Philadelphia where Obama received 85.2% of the vote, resulting in a margin of 492,339 votes. Romney’s largest margin in any municipality is 6,714 votes in Hampfield Township in Westmoreland County. The total aggregated margin in all 2,031 municipalities won by Romney is 696,033, slightly more than the Obama margin in the ten municipalities listed above. Full details, including party and swing maps can be viewed on the Pennsylvania 2012 Town page. The forum topic is located here.
For members, there are now available county township maps on the individual county results pages. In addition, the same maps and data are now available for President in the general elections of 2000, 2004, and 2008.