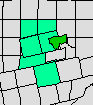
 Virginia 2013 Gubernatorial Swing Map The margin swing in the 2013 Virginia Governor’s race relative to the 2009 election was nearly 20% towards the Democrats. The 2013 result was Democrat Terry McAuliffe over Republican Ken Cuccinelli by 2.6% (47.8%-45.2%). In the 2009 contest, Republican Bob McDonnell defeated Democrat Creigh Deeds by 17.3% (58.6%-41.3%). As shown by the map, most of the counties and cities in the state swung Democratic. A dozen counties in the Appalachian region bordering West Virginia plus Patrick County swung Republican. Most of these had relatively modest Republican swings. An exception to this, however, are three adjacent counties in the northwest portion of the state: Alleghany, Bath, and Highland along with Covington City (which lies wholly within Alleghany County). These three counties plus city exhibited swing percentages that significantly bucked the statewide swing, recording vote margins that surged Republican by 31%, 51%, 21%, and 26% respectively. Bath County in particular, with a Republican swing percentage of 51% makes for a state-level trend move of 71% (51% Republican swing in the county plus 20% Democratic swing statewide).
Virginia 2013 Governor - Margin Swing
| County | Margin 2009 | Margin 2013 | Margin Swing |
| Bath County | D+27% | R+24% | R+51% |
| Allegheny County | D+23% | R+9% | R+31% |
| Covington City | D+32% | D+6% | R+26% |
| Highland County | R+10% | R+31% | R+21% |
| Statewide | R+17% | D+3% | D+20% |
While often such outlying data can suggest an error in the tally, this result is simply a matter of the area voting for favorite son Creigh Deeds in 2009 and returning to the regional voting pattern in 2013. Creigh Deeds is from Bath County and represented the 25th district in the Virginia Senate (In 2009, Bath County, Allegheny County, and Covington City were all within the 25th district). These counties also have very small populations (in 2013, Highland County had only 903 total votes counted, Bath County had 1,213, Allegheny County had 4,136, and Covington City had 1,275). The full swing table (member feature) can be viewed here.
Purchased spreadsheet files from the Dave Leip’s Election Atlas store now include a new option to download county-level comma-separated value (csv) files that include the FIPS codes, county names, total vote, and vote data from each party/candidate – for the entire nation in one text-based file. These new files are currently available by county for all general election vote results data sets for U.S. Senate, U.S. Representative, Governor. The csv files are also available for general elections for President back to 1936. The csv and Excel versions of any purchased files may be downloaded on your myatlas page.
The 2013 New Jersey General Election Gubernatorial Results are now official – posted by the New Jersey Division of Elections in the document Official List Candidates for Governor For General Election 11/05/2013 Election on December 4, 2013. The final results are Republican Chris Christie 1,278,932 (60.2%), Democrat Barbara Buono 809,978 (38.2%), Libertarian Kenneth R. Kaplan 12,155 (0.57%), Green Party candidate Steven Welzer 8,295 (0.4%) and four other minor party candidates with a combined total of 11,506 votes (0.54%). The margin of victory is 466,714 votes (22.2%). The Election Atlas also includes in its tally 2,175 write-in votes collected from individual county election reports that are not included in the “Official List” document.
Overall, the result is a solid Republican win for the incumbent in a heavily Democratic state. The last time a Republican won the race for Governor in New Jersey by such a large margin was by Thomas H. Kean in 1985. In 2013, Christie won all but two counties (falling short in Essex and Gloucester) – picking up six more counties relative to his win in 2009 on the back of an 18.6% swing statewide. His strongest showing was in Ocean County (75.7%) and had his largest swing in Hudson County (32.3%) although still coming up short of winning the county by 11.1%. The total votes counted in 2013 are 2,106,377 – a significant drop from 2009, where 2,425,441 votes were tallied (a drop of 319,064). Christie received 95,208 more votes vs. his run in 2009 while Buono received 284,792 fewer votes in 2013 than Jon S. Corzine did on the Democratic ticket in 2009. Full results are available for exploration here.
The New Republic has published an article titled “The Mysterious Town That Voted For Ron Paul” based on the Election Atlas Maine statewide township map of the 2012 General Election results for President (it links to this weblog post). The Atlas has a weblog entry on this very topic published back on June 28, 2013. The New Republic article expresses some concern on the validity of the result based on the lack of lack of existing modern information about Concord Unorganized Township on the web and the absence of election results from Concord UT in recent elections. As for the latter concern, there is recent evidence of consistent results reported from Concord UT. In addition to the three votes cast for President in 2012 from (all write-ins for Ron Paul), there are also three votes cast for U.S. Senate, U.S. House of Representatives District 2, State Senate District 26, and State Representative District 88. Furthermore, while 2012 was the first modern year that Maine published Presidential Election results separately for Concord UT, the Maine 2010 General Election results as published by the Maine Bureau of Corporations, Elections & Commissions also include three votes for Governor from Concord UT (two for Republican Paul LePage and one for Independent Eliot Cutler) as well as three votes each for U.S. Representative, State Senator, and State Representative. Another mention of Concord UT separately is a voter registration report from November of 2006 that includes five registered voters (four Unenrolled and one Republican). Earlier reports of election results mention that Concord UT results are included with Solon Township (example: General Election Tabulations November 2, 2004).
 Elections Administered by Millinocket A number of the gray-shaded towns in the Maine statewide township map have residents, but not governments that administer elections. Rather, larger surrounding townships administer elections in the unorganized townships and include these votes in their tallies. One example is that of Millinocket (dark green in map at right), where the town administers elections in Penobscot Unorganized Townships 3 and 4, Long A UT, Cedar Lake UT, T1 R9 WELS UT, and T1 R8 WELS UT (all in light green). Sometimes, the election results or voter registration figures for these outlying unorganized townships are tallied separately, sometimes they are added to the votes cast within the administering township, and sometimes they are reported as an aggregate separate from the administering township. Results vary from year to year.
 Saguache County, CO The Colorado Office of the Secretary of State publishes a biennial report of official election results for the several elections held in the preceding two years. Often the results presented within this abstract differ from the on-line reports published on the agency website shortly after the election. The 2012 Abstract of Votes Cast has only small deviations in the votes for Saguache County relative to the results published in the January 2012 on-line report. The differences are Barack Obama (D) +1, Roseanne Barr (P&F) +2, Anderson (Jus) -2, Tittle (WTP) +1, Miller (ATP) -1. The Atlas database has been updated with this minor change. Full results of the Colorado 2012 General Election Results for President are available on the Atlas here.
|


