Nebraska 2014 Republican Gubernatorial Primary
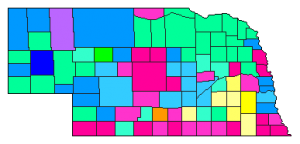
The Nebraska 2014 Republican Gubernatorial Primary was a competitive six-way contest with a very flat result. No candidate received more than 27% of the vote, four candidates received more than 19%, and every one of the six candidates won in at least one county. Omaha businessman Pete Ricketts came out on top with a preliminary unofficial total of 26.5% (57,922 votes), followed closely by Nebraska Attorney General Jon Bruning at 25.49% (55,751 votes), State Senator Beau McCoy at 20.94% (45,804 votes), and State Auditor Mike Foley with 19.22% (42,029 votes). Trailing were Tax attorney Bryan Slone with 4.13% and State Senator Tom Carlson with 3.74%. Across the state, only three counties were won with more than 40% of the vote – the top one being Phelps County won by fifth place finisher Carlson with 49.7% (his home town is Holdrege located in Phelps County), Ricketts won Morrill County (in the panhandle) with 42%, and Foley won Lancaster County with 41%. The table below summarizes the results:
Nebraska 2014 Republican Primary Results (Unofficial)
| | Candidate | Total Votes | Percentage | Counties Won |
 | Pete Ricketts | 57,922 | 26.48% | 26 |
 | Jon Bruning | 55,751 | 25.49% | 32 |
 | Beau McCoy | 45,804 | 20.94% | 27 |
 | Mike Foley | 42,029 | 19.22% | 7 |
 | Tom Carlson | 9,034 | 4.13% | 1 |
 | Bryan Slone | 8,179 | 3.74% | 1 |
The Pie chart at right is the statewide breakdown of the vote for the six candidates. Rickett’s strongest vote margins were in the Omaha area of Douglas and Sarpy Counties, where he had a combined margin advantage of 5,427 votes. Fourth-place finisher, Foley, had the highest-margin county in Lancaster, where he topped Bruning by 5,986 votes and Ricketts by 6,363 votes. However, he did not have sufficient state-wide support to achieve victory. Bruning’s support was more dispersed, winning the most counties, concentrated in the north and west, but not having any high-margin counties. McCoy is similar to Bruning, with his support concentrated in the central and southern portions of the state. Carlson and Slone both had more than 30% support in only a single county each. Below is a full interactive mouse-over map.
Polk County has the smallest win percentage, where Bruning won with 310 votes (24.12%) to 306 for Foley, 302 for Ricketts, 299 for McCoy, Carlson at 50, and Slone at 18. An almost even 4-way split! The full results page on the atlas is located here.