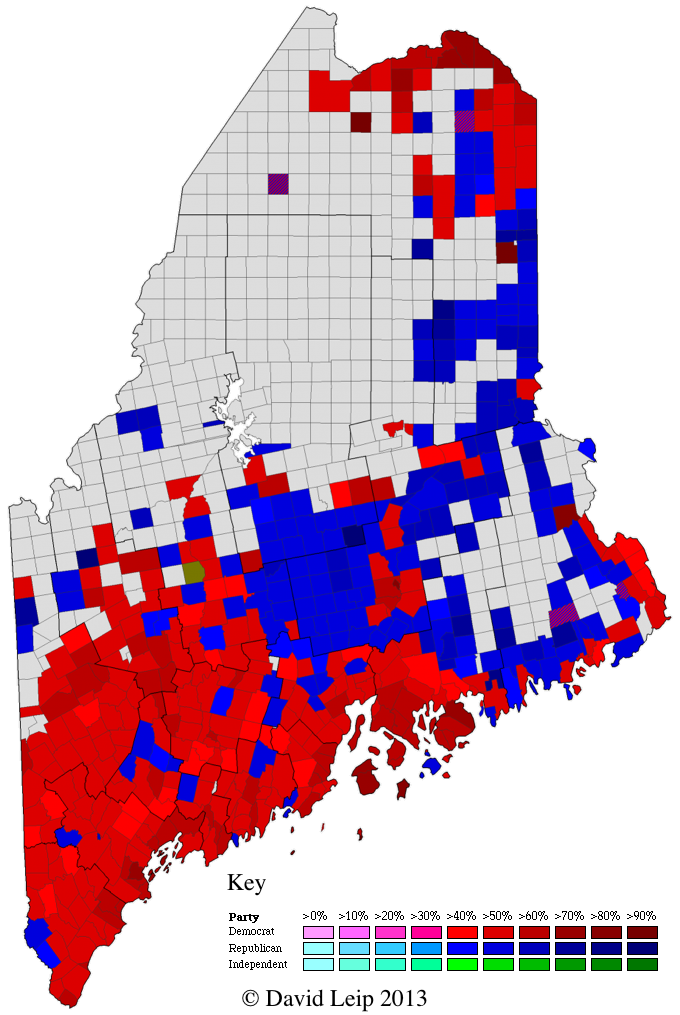
The 2012 Presidential Election Map by Town for the State of Maine has been added to the Atlas (at right – click for a larger image). The results for Maine are a challenge to map because the Maine Secretary of State lists results for many individual unincorporated townships that the US Census Bureau aggregates into larger geographic regions. For example, the official election results in Washington County include a separate entry for Edmunds Twp (census aggregates into East Central Washington UT), Brookton Twp (census aggregated into North Washington UT), etc. In total, there are 26 unincorporated townships in the 2012 General Election results that are not listed as separate geographic unincorporated townships by the US Census Bureau. To further complicate matters, Maine tends to change which of these townships report from year to year. In 2012, first-time listings include Concord and Spring Lake Twp (Somerset County), Lang Twp (Franklin County), T11 R4, T12 R13, T15 R6, T15 R9, TD R2 (Aroostook County), T7 SD (Hancock County). E Twp in Aroostook County made its first appearance since 1988. Township 14 (Washington County) did not make an appearance in the 2012 Election Results – although its possible that this is actually the entry “Cooper Twps” listed in the Maine Official Election Results. There are a total of 24 entries of vote results that are not associated with a town (such as “Mattawamkeag Twps” – in this case, the results for this entry are from voters in unincorporated townships that have elections administered by Mattawamkeag). Actual geographic origin of these votes in these 24 unincorporated township groupings is under investigation.
To facilitate faster generation of Maine Township Maps for elections, significant effort has been expended to create a database that is relevant to the posted election results. The map above is the first of these to be created based on this new database. It includes all the census county subdivisions plus all the unincorporated townships split out as defined by the State of Maine – resulting in a beautiful map. FIPS codes for these non-census townships are created by the Atlas in a manner consistent with the census numbering (no existing FIPS codes exist for these townships). More Maine maps to be added in the coming days.
At right is a thumbnail of the 2012 New York Presidential Election results map by county subdivision (click on map for large version). The 2012 map is very similar to the 2008 New York map. Of the 997 cities and towns, 926 of them were won by the same party in both 2008 and 2012. President Obama had 32 pickups, with 40% of these in four Central New York counties (four towns in Oswego, three towns in each Cayuga, Cortland, and Seneca). The largest pickup is Richmond County (Staten Island Borough), changing from a Republican 4% margin in 2008 to Democratic 2.6% margin – a swing of 10,709 votes, or 6.6%. Mitt Romney had 39 pickups and were concentrated in Western New York and Southeastern New York (four in each Chautauqua, Dutchess, and Westchester with three in each Otsego and Orange). His largest pickup is Huntington in Suffolk County (total vote of 91,971), with a swing of 6,866 or 7%. In total, Romney won 631 cities and towns vs. Obama’s 365 (one is a tie). However, for the most populous cities and towns (those with greater than 10,000 ballots cast), Obama wins 73 to Romney’s 24, including all five New York City boroughs that alone had a combined margin of 1,553,717 votes. Note that this map requires significant effort to compile as all data by town must be compiled from precinct reports obtained from each individual county board of elections.
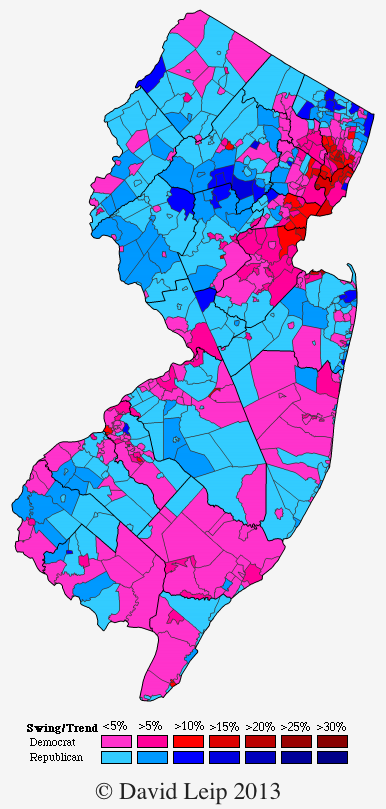
One way to look at geographical election trends is the swing map – defined as the change in margin between the top two parties from election to election. For example, if County A is won by the Democrat in 2008 with 54% of the vote to 46% and by the Republican in 2012 with 51% of the vote to 49%, the swing is 10 percentage points towards the Republican (D+8 to R+2). The maps can be used to highlight variables of an election such as home state advantage (see Robert Dole in 1996), candidate positions (example: 2012 shift in eastern Kentucky), and many more.
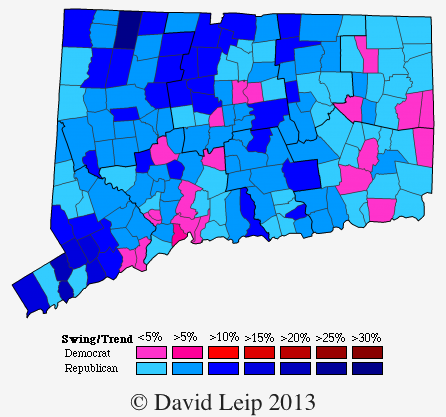
Another example from 2012 is the New Jersey Swing Map by municipality shown at right (click the map to enlarge). New Jersey is one of only six states that swung towards the Democratic party in the 2012 General Election (complete list of the 2012 presidential swing results by state). New Jersey is a unique case in 2012 because just days before the election, the area was struck by a powerful post-tropical cyclone (formerly known as Hurricane Sandy), causing immense damage. Among much misfortune, the storm also disrupted the election process. The most recent official results by the New Jersey Department of State Division of Elections wasn’t posted until February 6, 2013 and even this tally does not capture all the votes from each county (amended results in Essex, Monmouth, and Morris counties are included in the Atlas, but are not included in the Division of Elections tally). Analyzing the electoral impact of such an event is complex, but given the swing map above when compared to the nation as a whole and even nearby states such as Connecticut, it appears to suggest that many citizens of New Jersey responded favorably at the ballot box to the incumbent President Obama’s response to the crisis.
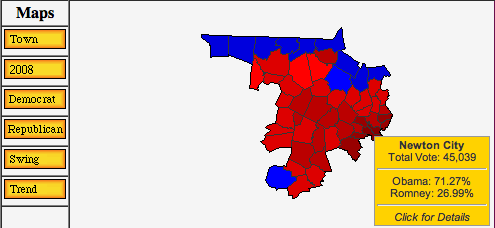
The Atlas is in the process of upgrading the county township maps in the members section. Going beyond the previous flat vote result map, the new maps are enhanced and greatly expanded, including an image-map to highlight the name of the city/town and the summary result in a pop-up window, include mouse-over maps/links for party, swing, trend, and the previous vote result. In addition, the maps are also larger. Currently, these new maps and features are available for President in 2012 and 2008 in New Hampshire, Vermont, Massachusetts, Connecticut, New York, Rhode Island, as well as brand new maps for New Jersey. I’m currently in the process of creating the Maine maps – an endeavor that is taking quite some effort due to the large mismatch between the available census maps and the township entities that are included in the Maine official results. Future expansion of this feature is planned to include more states, more offices, and more elections further back in time.
The 2013 Special United States Senate Election in Massachusetts preliminary results have been posted. The contest between Democratic Congressman Ed Markey, representing the Massachusetts 5th district and Republican Gabriel Gomez has ended with a 54.8% to 44.8% victory for Markey. This is a Democratic hold of the seat vacated by now Secretary of State John Kerry.
The map at the right shows a small version of the statewide results in Washington of the 2008 General Election for President by precinct (Obama in Red, McCain in Blue). This was made possible because the Washington Secretary of State has posted all the precinct-level GIS shape files. Most of the shape files line up with the county precinct data (although there are a number of discrepancies). The map link to the right brings you to the forum topic discussion on the 2008 Presidential Results by Precinct in Washington. The maps provide a very detailed geographic breakdown of the results, clearly showing the urban-rural split that has developed between the Republican and Democratic regions of support. Additional tweaking of the map is planned to incorporate the closest match to precinct boundaries used in the 2008 General Election for several counties.
Obama was victorious in 372 cities and towns to McCain’s 623 (there were two ties). However, Obama’s 372 victories were in places of considerably higher population – those 372 cities and towns cast 5,961,925 votes for Presidential Candidates, whereas in McCain’s 623 cities, and towns, a far less 1,679,564 votes were cast.
Relative to 2004, Obama increased Democratic victories by 154 (a 70% increase), many of the Republican-to-Democratic flips were in Upstate suburbs, the North Country (Northern Adirondacks and Quebec border), and in the Catskill region. Three towns flipped from Kerry to McCain (Throop (Cayuga), Brant (Erie), and Sangerfield (Oneida)).
The unofficial results are in from the competitive 2006 Republican Primary for Seante in Rhode Island. In this race, incumbent Senator Lincoln Chafee was challenged by Cranston Mayor Steve Laffey. The unofficial result published by the Rhode Island Board of Elections is: Chafee (i) 34,407 (54.22%); Laffey 29,052 (45.78%), a margin of about 8 percentage points.The township map reveals the strength of each candidate. Laffey performed best in the North (Providence County) outside the city. His best municipality is the town of Johnston where he won 62.8% of the vote. In his home-town city of Cranston, he received his largest vote margin of 447 votes, capturing 52.5% of the vote. Chafee had his strength in the city of Providence and the south of the state (Bristol, Newport and Washington Counties). His best municipaility is the town of New Shoreham (Block Island) where he received 78.3% of the vote. Chafee received his largest vote margin in the City of Warwick – 2,134 votes where he won 62.3% to 37.6%.An interesting statistic with regard to the lack of Republican Strength in Rhode Island – in the City of Providence (2000 Voting-Age Population of 128,341 – almost twice as many people as in Warwick, the second largest city): the total number of votes cast in the Republican primary was 2,941 votes, 1/5th the 14,861 votes cast in a far-less-competitive Democratic Primary.
The preliminary results of the 2006 Connecticut Senatorial Primary between incumbent Democrat Joseph Lieberman and challenger Ned Lamont are in. With 99.6% of the precincts having reported, Lamont defeats Lieberman 146,065 to 136,150 (51.8% to 48.2%). This is a more narrow margin than the more recent polls by Rasmussen and Quinnipiac University had predicted.The preliminary town results map (shown at right) shows the relative strenghts of each of the two Democratic candidates. Much of the state was relatively evenly split. Lieberman was strongest in the route 8 corridor – West Haven, Derby, Ansonia up through Naugatuck, Waterbury and Thomaston. Lamont’s strength was centered in the northwestern portion of the state (Litchfield County – with his strongest town Cornwall), the south near Lyme, the northeast near Mansfield, and Lamon’t hometown, Greenwich.


 The 2012 Presidential Election Map by Town for the State of Maine has been added to the Atlas (at right – click for a larger image). The results for Maine are a challenge to map because the Maine Secretary of State lists results for many individual unincorporated townships that the US Census Bureau aggregates into larger geographic regions. For example, the official election results in Washington County include a separate entry for Edmunds Twp (census aggregates into East Central Washington UT), Brookton Twp (census aggregated into North Washington UT), etc. In total, there are 26 unincorporated townships in the 2012 General Election results that are not listed as separate geographic unincorporated townships by the US Census Bureau. To further complicate matters, Maine tends to change which of these townships report from year to year. In 2012, first-time listings include Concord and Spring Lake Twp (Somerset County), Lang Twp (Franklin County), T11 R4, T12 R13, T15 R6, T15 R9, TD R2 (Aroostook County), T7 SD (Hancock County). E Twp in Aroostook County made its first appearance since 1988. Township 14 (Washington County) did not make an appearance in the 2012 Election Results – although its possible that this is actually the entry “Cooper Twps” listed in the Maine Official Election Results. There are a total of 24 entries of vote results that are not associated with a town (such as “Mattawamkeag Twps” – in this case, the results for this entry are from voters in unincorporated townships that have elections administered by Mattawamkeag). Actual geographic origin of these votes in these 24 unincorporated township groupings is under investigation.