


The Primary Predictions for the GOP and Democratic nomination contests have been up for a few weeks. Although these features greatly simplify the (very complex) process, they provide an interesting excercise in running scenarios in the present dynamic environment. The prediction for the state of Iowa is closing at noon (EST) on January 3 – so, if you want to get complete primary predictions in, be sure to do prior to that time. Predictions for contests held in other states will close at noon (Eastern) of the day in which the respective election or caucus is held.
Category Archives: New Feature
New Atlas Weblogs
The Atlas Weblog system has been upgraded to WordPress Mu – a scaleable blogging system for multiple users. Please send me a note if you have an interest in publishing your own free weblog on this site. The system also includes custom pages and will support your own weblog ads, if desired.
New Predictions for 2008
 |
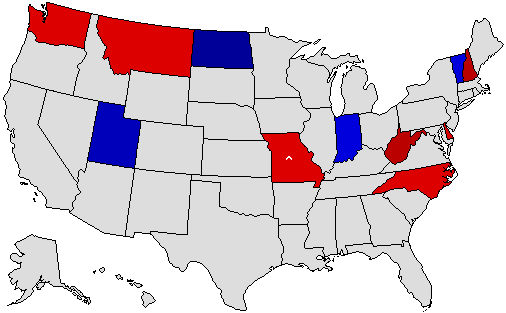 |
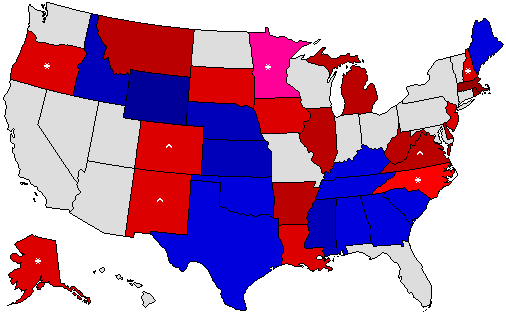
Prediction scripts are now available for the 2008 Senate Election and the 2008 Gubernatorial contests (joining the already-available 2008 Presidential Predictions. The 2006 Senate aggregate prediction called 32 of 33 contests correctly – only missing Virginia. The 2006 Gubernatorial aggregate prediction called 35 of 36 contests correctly – only missing in Minnesota. Give a try at election prognostication! Continue reading
The 2008 Primary Mock Elections
With all the clamoring amongst the states to move primary contests to the front of the line, the Atlas has decided to leapfrog them all, unveiling today the 2008 Presidential Primary Mock Election contests: the 2008 Republican Mock Election and 2008 Democratic Mock Election. The Atlas Mock Elections in each state are set up as open primaries (meaning that any registered voter of any party affiliation may cast a ballot in either the Democratic or Republican primary). In the real primary and caucus system, each state sets the rules for participation:
- Open primaries allow voters of any party affiliation to vote
- Modified open primaries allow independent or unaffiliated voters as well as those affiliated with the party holding the election contest
- Closed primaries limit the participants to those registered with the party holding the election contest
The allocation of delegates for the Atlas Mock Primaries are modeled after the rules for each state – typically awarding delegates proportional to the popular vote in a given state or via winner-take-all (the same system as 48 states and the District of Columbia use in the general election to award Presidential Electors). In the real primary system, a certain set of delegates are allocated via the vote in congressional districts – this level of detail has been omitted on the Atlas mock election – where all the district delegates are awarded as part of the “at large” group. Overall, the primary process is quite complex.
Go now and cast your ballot!
Atlas Community Election Endorsements
Several members of the Atlas community have suggested providing a feature for members to share their endorsements of candidates for the 2006 Senatorial and Gubernatorial contests. This feature has now been added to the Atlas (Links: Gubernatorial Endorsements and Senatorial Endorsements). A compiled map on the endorsements home page shows the aggregate of community endorsements. The new scripts include pages to show state-by-state listing of endorsement totals for each candidate.
2006 Election Polls
Two new sections are now available on the Atlas – Gubernatorial Election Polls for 2006 and Senatorial Election Polls for 2006. The new polling sections include the ability to view individual polls in detail as well as summary pages comparing recent polls by state and by polling agency. The main page includes a compilation of the most recent three polls for each state and presents a map of the result showing the current status of who is ahead on a per-state basis as well as a table showing the current view of the pick-ups for each part. Also included is a trend graph illustrating the number of states ahead for each party starting in February of 2006.
2006 Election Predictions
The 2004 Presidential Predictions turned out to be a very popular Atlas site feature – with almost 2,000 unique entries (and over 12,000 total version entries). The compiled map showed the correct winner of every state – with the exception of Ohio – which missed being called by merely two Republican predictions (1,000 Democratic calls vs. 998 Republican).
For 2006, new prediction scripts and databases for the Gubernatorial and United States Senate races have been created. The predictions have been expanded to include independent candidates, show party “pick-ups”, and has more integration with the Atlas Forum.
Participate and Enjoy!
Total Ballots Cast
Total Ballots Cast are figures published by most election agencies that show the total number of people having cast ballots. Typically, a number of these ballots for any given contest (e.g. President) are invalid – either the voter decided not to choose a candidate for President (called a “blank” or “under-vote”) or the voter selected multiple candidates (called a “void” or “over-vote”).
Figures for Total Ballots Cast in the 2004 and 2000 general elections for President have been added to the database at the state, county, township, and precinct levels for all states in which this data is available. These data may be accessed by using the customize form at the bottom of any detailed data table (Atlas Membership required for county, township, and precinct-level). In addition, there are options to display the total number of invalid ballots and percent invalid for each in the table. For an example, take a look at the 2004 state-level data table with the new data included. Data for previous years are also in process of being added to the database.
Margin Swings & Trends
Swing Map |
Trend Map |
Upon a suggestion from Alcon, I have created swing maps by county between the 2000 and 2004 elections. These maps describe the change in margin percentage (i.e. the difference between the Democratic vote percentage and the Republican vote percentage) between the 2000 election and the 2004 election. The maps may be found on the state summary pages (example). These maps show the change in support on a percentage basis for each county between the successive elections. In the New Jersey map to the right, the margin in every county swung towards Bush. The very light blue represents a change of < 5%, the light blue between 5% and 10%, the blue between 10% and 15%, and the dark blue 15% to 20% (see the Atlas Master Key for complete color and margin assignments).
(edit: 20051101) A second set of maps have been produced that show the county “trend” between the 2000 and 2004 elections. The trend map differs from the swing map in that the margin change is normalized to the nation-wide margin change (i.e. MarginCounty2004 – MarginNational2004 – (MarginCounty2000 – MarginNational2000) where each Margin is (VoteD – VoteR)/TotalVote). So, as an example, consider Hunterdon County, New Jersey:
| Year | VoteD | VoteR | TotalVote | Margin | Margin% |
| County | |||||
| 2004 | 26,050 | 39,888 | 66,680 | 13,838 | 20.75% |
| 2000 | 21,387 | 32,210 | 56,455 | 10,823 | 19.17% |
| Swing | 4,663 | 7,678 | 10,225 | 3,015 | 1.58% |
| National | |||||
| 2004 | 59,028,439 | 62,040,610 | 122,300,762 | 3,012,171 | 2.46% |
| 2000 | 51,003,926 | 50,460,110 | 105,417,258 | 543,816 | 0.52% |
| Swing | 8,024,516 | 11,580,500 | 16,883,504 | 3,555,987 | 2.98% |
| County Trend 2000 to 2004 | |||||
| (County Swing – National Swing) | 1.40% | ||||
To calculate the swing in Hunterdon County, subtract the margin percentage in 2000 from the margin percentage in 2004 -> an increase for the Republicans of 1.58%. Therefore the swing map shows Hunterdon County for Republican by < 5%. The trend is a normalization of the county margin change based on the national margin change. The trend is calculated by subracting the national margin swing from the county margin swing. Since the margin for Republican nationwide increased by 2.98% and the margin in Hunterdon County swung a smaller 1.58% towards the Republicans, the trend in Hunterdon County is 1.40% towards the Democrats. The map therefore shows Hunterdon County for Democratic by < 5%.
Feedback is welcome on all aspects of the feature (color selection, number of bins, whether it is useful or interesting, etc.).
AtlasWiki
 The Atlas now has a Wiki! The community pages are intended as an area for contribution by interested parties in the area of Presidential Elections, History, US Politics, as well as repository for community interaction. I envision the wiki to include additional information related to elections – such as defining terms (examples include Fusion, Caucus, Primary, etc.), articles on historical election patterns, candidate biographies, political party information, interesting trivia, etc. Cross-linking between the main atlas database and the wiki helps to improve the educational aspect of the site. Please send me an email if you are interested in contributing to the Wiki.