


The complete Wisconsin 2012 Presidential Election 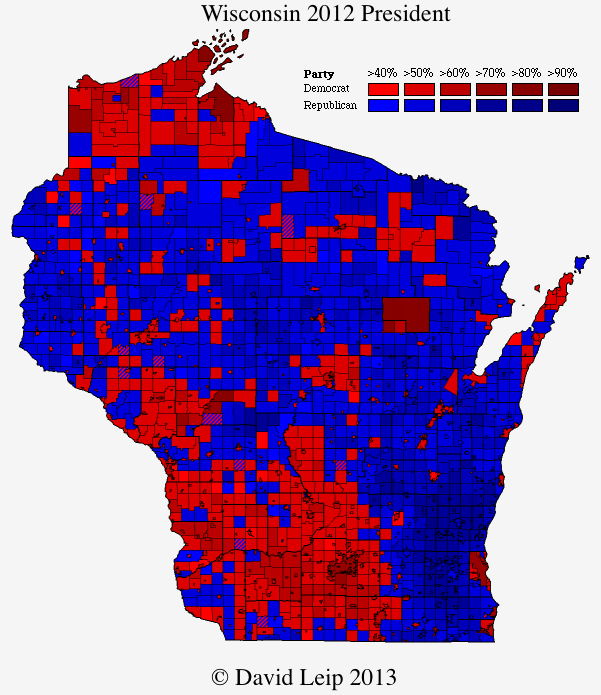 results map by county subdivision (town, city, village) between Democrat Barack Obama and Republican Mitt Romney is now complete. The map at right is the thumbnail of the result (click on map for larger version). Mitt Romney won 1,070 municipalities and Barack Obama won 809 (there were 16 ties). This was a significant improvement over 2008, where Republican John McCain won only 649 municipalities and Barack Obama won 1,232 (with 15 ties). Like in other states, the municipalities with the largest number of votes cast were dominantly won by Barack Obama. Of the cities with more than 30,000 votes cast, Obama won 10 of 11, accounting for a margin of 325,338 votes. Milwaukee and Madison alone accounted for a vote margin of 258,938 votes. Compared with the overall state-wide margin of 213,019, these population centers secured the victory for Obama in Wisconsin.
Monthly Archives: August 2013
2013 Gubernatorial Endorsements Now Active
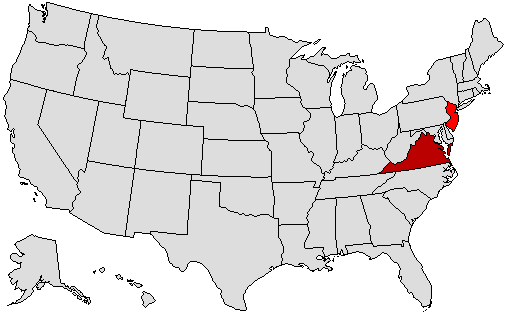 The 2013 Gubernatorial Endorsements are now active. There are only two contests this year – New Jersey and Virginia in which to share your preference.
2010 Gubernatorial County Subdivision Maps
New County Subdivision maps have been added for New England States (Massachusetts, New Hampshire, Vermont, Maine, Connecticut, and Rhode Island) for the 2010 General Election contests for Governor. At right is the results for the three-way Gubernatorial contest in Maine – a close win by Republican Paul LePage over Independent candidate Eliot Cutler and Democratic candidate Libby Mitchell. LePage won with 38% of the vote to 36% for Cutler and 19% for Mitchell. LePage dominated the inland towns, while Cutler won in many of the coastal communities. Libby won in the far north and Native American townships.
A second three-way race in the 2010 General Election took place in Rhode Island, where Independent Lincoln Chafee won a three way contest against Republican candidate John Robitaille and Democratic candidate Frank Caprio. Chafee won with only 36% of the vote. Robitaille had 34% and Caprio received 23%. Chafee won the Providence area and south coast, Caprio took three communities north and west of Providence, while Robitaille won the North and West of the state.
The contests in both Connecticut and Vermont were very competitive – Democratic candidate Dan Malloy won in the Constitution State over Republican Tom Foley by a mere 6,404 votes (49.5% to 49.0%). In the Green Mountain State, Democrat Peter Shumlin won over Republican challenger Brian Dubie by 4,331 votes (49.5% to 47.7%).
In Massachusetts, Democratic incumbent Deval Patrick was reelected with a plurality of 48.4%. Republican Charlie Baker was second with 42%, Independent Tim Cahill had 8%, and Green-Rainbow candidate Jill Stein received 1.4%.
The only New England state to have a 2010 Gubernatorial winner with a majority of the vote was New Hampshire, where incumbent Democrat John Lynch won his third reelection bid – this time with a significantly smaller margin against Republican John Stephen (52.6% to 45.0%). Libertarian John Babiarz received 2.2%.
New Trend and Swing Maps for U.S. Senate
Rounding out the expansion of swing and trend maps on the Atlas, the U.S. Senate state summary pages from 1996 through 2012 now include mouse-over county-level swing and trend Maps.
New York Releases Third Set of Amended 2012 Election Results
Following the release of the Kings County amended 2012 General Election results on July 2, 2013 by the New York City Board of Elections, the New York State Board of Elections released a new set of amended results files on July 29, 2013. This is the third set of amended results released by the NYSBOE following the release of the certified results on December 31, 2012. Previous amended results were released on February 6, 2013 and April 9, 2013. This latest set of results only includes changes to Kings County, and still do not include the updated final official results from Rockland County (published on 01/09/2013). The notes on the Atlas for the 2012 New York Presidential General Election Results have been updated to reflect the official nature of the Kings County amended results.
New Trend and Swing Maps for Governor
New maps are now active for county-level trend and swing results in Gubernatorial contests from 1992-2012. These include mouse-over buttons on the state-level summary pages to reveal the swing or trend maps. The buttons link to the detailed county-level data, comparing the results and swing (or trend) side-by-side. This feature is the same as the existing maps for President – they compare the change in Democratic-Republican margin from the previous general election to the one being viewed. For cases where the previous general election was an off-year special election, the reference election for the swing and trend maps is the special election.
Previous Election Map Button Added for Governor and US Senate
New maps have been added to the Gubernatorial and US Senate state summary pages – the mouse-over buttons to the left of the county results map now include one linking a map for the previous general election result, providing the same functionality to compare the result to the previous election that already exists for the Presidential state-level county maps.