


 The Atlas has incorporated a new map set – statewide city and town maps (county subdivision) for New England states (plus NY and NJ for some Presidential Elections). Currently, maps are available for President 1992-2012 and Governor in some contests from 1990-2012, with more on the way. These statewide maps include mouse-over map buttons for party, swing, trend, and last election result (same function as available on the county map pages). In addition, these statewide maps include image-maps with a pop-up box that shows the city or town name plus the high-level election result. Clicking on a city or town opens the results page for that county subdivision. The 2012 maps are available to members and non-members alike, but due to the high-data content of these pages, older election maps are currently limited to the members section.
Monthly Archives: July 2013
More County Subdivision Maps
More county subdivision maps for US President in the general elections of 1992 through 2004 have been created for New York and the six New England states (ME, NH, VT, MA, CT, and RI). In addition, New Jersey 2004 maps have also been added. These include party maps, swing map, trend map, and last election map. At the same time, new anti-aliased pie charts have also been added to the individual county results pages. More of these maps for President (back further in time), Governor, US Senator, and Presidential Primaries are in the queue.
Bernie Sanders Wins All 246 Towns in 2012 General Election
 Bernie Sanders, an independent running for re-election to the United States Senate in Vermont, won all 246 towns in the 2012 General Election. With no Democratic candidate in the contest, Sanders won a solid state-wide victory with 71% of the vote to Republican John MacGovern’s 25%. Chris Ericson of the United States Marijuana party had 2.0% with four other candididates making up the rest (full results). This bested his 2006 result where he received 65% of the vote and won all but two towns (one of the two was a tie).
In recent years, a fairly uniform result across the state in US Senate elections has been relatively common. Republican Jim Jeffords won all towns in 2000, Democrat Patrick Leahy won all but one town in 2004 and all but ten in 2010.
New Maine County Township Maps
Individual Maine county township maps for the 2008 and 2012 General Elections for President have been created. These include swing, trend, and party maps with full mouse-over image maps. The maps are a result of the recent work to build an election mapping database for Maine to include the unincorporated townships missing from the US Census county subdivision database.
Massachusetts 2013 Special Senate Town Map
 On Wednesday of last week, the 2013 Special US Senate election in Massachusetts (held on June 25) was certified. The final tally is Democratic candidate Ed Markey with 645,249 (54.8%), Republican Gabriel Gomez 525,307 (44.6%), Twelve Visions Party candidate Richard Heos 4,550 (0.4%) and “All Others” with 2,504 (0.2%). The Atlas entry for this election is located here. At right is a thumbnail of the map by city and town (click for larger image). The total ballots cast in this special election was 1,179,781 – over two million votes less than were cast in the 2012 General Election. Even relative to the 2010 Special Election, the number of ballots cast is only half the 2,253,727 ballots cast on January 19, 2010. The 2013 special election stands out in the low-level of turnout.
 Compared with the 2010 Special Election (city and town map shown at right), the 2013 map looks quite similar. Only 36 of 351 cities and towns changed color – 35 Scott Brown municipalities were won by Ed Markey and only one (Monroe) was won by both Martha Coakley in 2010 and Gabriel Gomez in 2013. Three towns that were won by Scott Brown in 2010 were ties in 2013. The switch of these towns, however, only represent a margin change of 34,132 votes. A much larger Democratic swing is present (193,307) in the cities and towns that did not change hands. Detailed town data are posted on the individual contest pages (2010 and 2013).
Maine 2012 General Election Township Map – President
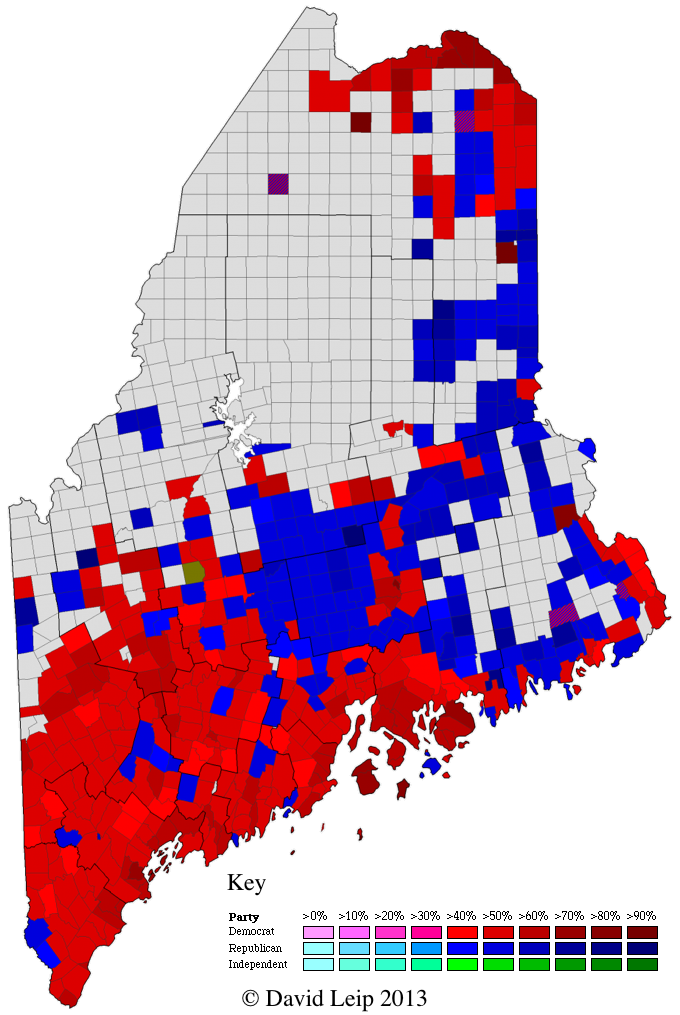 The 2012 Presidential Election Map by Town for the State of Maine has been added to the Atlas (at right – click for a larger image). The results for Maine are a challenge to map because the Maine Secretary of State lists results for many individual unincorporated townships that the US Census Bureau aggregates into larger geographic regions. For example, the official election results in Washington County include a separate entry for Edmunds Twp (census aggregates into East Central Washington UT), Brookton Twp (census aggregated into North Washington UT), etc. In total, there are 26 unincorporated townships in the 2012 General Election results that are not listed as separate geographic unincorporated townships by the US Census Bureau. To further complicate matters, Maine tends to change which of these townships report from year to year. In 2012, first-time listings include Concord and Spring Lake Twp (Somerset County), Lang Twp (Franklin County), T11 R4, T12 R13, T15 R6, T15 R9, TD R2 (Aroostook County), T7 SD (Hancock County). E Twp in Aroostook County made its first appearance since 1988. Township 14 (Washington County) did not make an appearance in the 2012 Election Results – although its possible that this is actually the entry “Cooper Twps” listed in the Maine Official Election Results. There are a total of 24 entries of vote results that are not associated with a town (such as “Mattawamkeag Twps” – in this case, the results for this entry are from voters in unincorporated townships that have elections administered by Mattawamkeag). Actual geographic origin of these votes in these 24 unincorporated township groupings is under investigation.
To facilitate faster generation of Maine Township Maps for elections, significant effort has been expended to create a database that is relevant to the posted election results. The map above is the first of these to be created based on this new database. It includes all the census county subdivisions plus all the unincorporated townships split out as defined by the State of Maine – resulting in a beautiful map. FIPS codes for these non-census townships are created by the Atlas in a manner consistent with the census numbering (no existing FIPS codes exist for these townships). More Maine maps to be added in the coming days.
Official 2004 Write-in Votes Added to the Atlas Database in DE and NY
The Atlas database has been updated to include additional Write-in Votes for President for the 2004 General Election in New York and Delaware. The state of Delaware publishes a “results book” after each election cycle. This paper publication (more recently provided as a more convenient pdf) includes more complete results, including official write-in votes that are not presented on the official election results posted on Delaware Commissioner of Elections 2004 Election Results web page. The Delaware 2004 Election Results book includes a total of 80 write-in votes for President (three are for Róger Calero the Socialist Workers candidate, the remaining are not cast for any of the other national candidates).
New York also printed a more recent (and unlabeled) version of the the 2004 Election Results for President and Vice President that includes more votes for qualified write-in candidates. This document has a creation date of May 9, 2005, but is not labeled as an amended version. It includes write-in votes for David Cobb, Michael A. Peroutka, and Bill Van Auken in a number of counties that were left blank in the December 2004 version of the document. The Peroutka vote increases from 207 to 363, Cobb from 87 to 138, and Van Auken from 2 to 4. This newer report, however, does not include any qualified write-in votes from the five New York City boroughs.
Lake County, TN Votes Double-Counted in 2004 General Election
A second example of double-counted votes was discovered this week – this time its Lake County, TN in the 2004 General Election. This discovery is an outcome of viewing the new statistics tables described in the previous entry. When examining the table for top percentage change in total votes 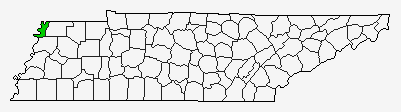 cast for President relative to the previous election, Lake County, Tennessee popped up as #3 on the increasing column with 113.13% in 2004 followed by a precipitous decrease of 52.78% in 2008 – a sign of a high-probability error. Official results obtained by the Lake County Election Commission confirms the correct data as follows:
| As Reported from the Lake County Election Commission | ||||||||||||||||||||||||||||||||||||
|
||||||||||||||||||||||||||||||||||||


The figures in the table are all exactly one half those reported by the Tennessee Secretary of State in the November 2, 2004 Election Results. The correct data from the Lake County Election Commission have been updated on the Atlas.
New Election Statistics Tables
The statistics page for each Presidential, US Senatorial, and Gubernatorial Election have been updated to include a new set of eight tables. Four of these highlight the states and counties with the largest swings from the previous election (both in raw votes and percentages). Additional tables also present states and counties with the largest change in total votes cast for the office (both as raw votes and percentages) to highlight some of the fastest growing and shrinking counties or the level of enthusiasm from election to election. An example swing percentage table from the 2012 Presidential Statistics is shown below:
States with Largest Vote Swing Percentage
| Republican | Democratic | ||
| Utah | 19.87% | Alaska | 7.55% |
| West Virginia | 13.65% | New Jersey | 2.21% |
| Montana | 11.26% | Mississippi | 1.68% |
| Indiana | 11.21% | Louisiana | 1.42% |
| North Dakota | 10.97% | New York | 1.32% |
New York 2012 Township Map
 At right is a thumbnail of the 2012 New York Presidential Election results map by county subdivision (click on map for large version). The 2012 map is very similar to the 2008 New York map. Of the 997 cities and towns, 926 of them were won by the same party in both 2008 and 2012. President Obama had 32 pickups, with 40% of these in four Central New York counties (four towns in Oswego, three towns in each Cayuga, Cortland, and Seneca). The largest pickup is Richmond County (Staten Island Borough), changing from a Republican 4% margin in 2008 to Democratic 2.6% margin – a swing of 10,709 votes, or 6.6%. Mitt Romney had 39 pickups and were concentrated in Western New York and Southeastern New York (four in each Chautauqua, Dutchess, and Westchester with three in each Otsego and Orange). His largest pickup is Huntington in Suffolk County (total vote of 91,971), with a swing of 6,866 or 7%. In total, Romney won 631 cities and towns vs. Obama’s 365 (one is a tie). However, for the most populous cities and towns (those with greater than 10,000 ballots cast), Obama wins 73 to Romney’s 24, including all five New York City boroughs that alone had a combined margin of 1,553,717 votes. Note that this map requires significant effort to compile as all data by town must be compiled from precinct reports obtained from each individual county board of elections.