


 One way to look at geographical election trends is the swing map – defined as the change in margin between the top two parties from election to election. For example, if County A is won by the Democrat in 2008 with 54% of the vote to 46% and by the Republican in 2012 with 51% of the vote to 49%, the swing is 10 percentage points towards the Republican (D+8 to R+2). The maps can be used to highlight variables of an election such as home state advantage (see Robert Dole in 1996), candidate positions (example: 2012 shift in eastern Kentucky), and many more.
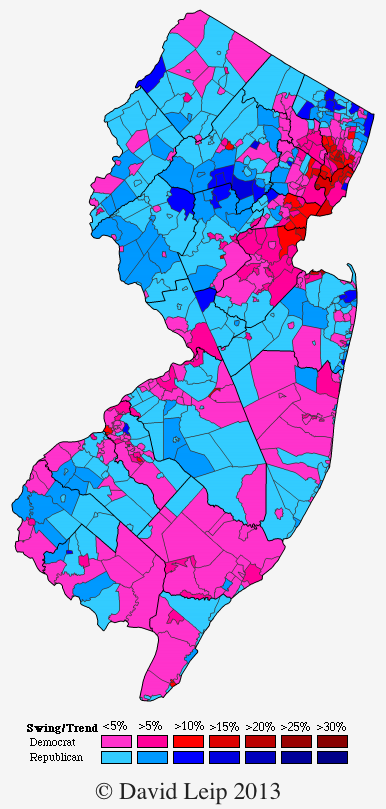
Another example from 2012 is the New Jersey Swing Map by municipality shown at right (click the map to enlarge). New Jersey is one of only six states that swung towards the Democratic party in the 2012 General Election (complete list of the 2012 presidential swing results by state). New Jersey is a unique case in 2012 because just days before the election, the area was struck by a powerful post-tropical cyclone (formerly known as Hurricane Sandy), causing immense damage. Among much misfortune, the storm also disrupted the election process. The most recent official results by the New Jersey Department of State Division of Elections wasn’t posted until February 6, 2013 and even this tally does not capture all the votes from each county (amended results in Essex, Monmouth, and Morris counties are included in the Atlas, but are not included in the Division of Elections tally). Analyzing the electoral impact of such an event is complex, 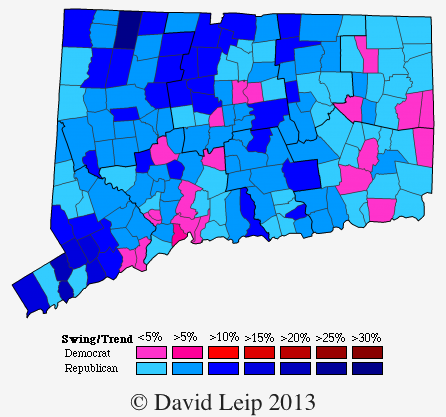 but given the swing map above when compared to the nation as a whole and even nearby states such as Connecticut, it appears to suggest that many citizens of New Jersey responded favorably at the ballot box to the incumbent President Obama’s response to the crisis.