


 Today is Election Day 2008! If you haven’t already done so, be sure to get to the polls and cast your ballot! Myself, having moved yet again, find myself in my fifth different voting precinct in the City of Newton – now in W3P2 (FYI, I’ve been in W2P1, W1P1, W2P2, W7P2, and now in W3P3). Once again, the ballots are optical scan ovals (I prefer this balloting technology – paper trail with fast computer high-accuracy scanning). The precinct location is at the Peirce Elementary School – with all the action I have come to expect – the place is active with the children attending class, the bake sale, and the citizens packing into the gymnasium to vote. There were more people in line this year relative to my past experience (Massachusetts, not being a swing state, doesn’t usually attract quite the crowds that are reported in states that are more competitive). Voting went off without a hitch. So, make your way to the polls!
Author Archives: leip
Predictions, Endorsements, & Mock Election
Predictions, Endorsements, and the Mock Election will wrap-up at 4pm on Election Day (Eastern Standard Time). Please complete your updates by then as the scripts will be closed. And for those of you whom are eligible, don’t forget to cast your real ballots (if you haven’t already done so)
UUorld GIS Software & Atlas Data
 The Atlas is partnering with UUorld (pronounced “World”) GIS software developer to provide election data in formats capable of being imported to the UUorld application. A link has been added to your myatlas page to the UUorld Export Script. All data sets purchased from the Atlas are available to you for export.
The application’s primary feature is the ability to extrude shapes in a three dimensional projection providing a geographic visual representation of relative data. 2-D mapping options are also available. One particular feature is the ability to produce animated time-series movies such the percent vote for Democratic Party Presidential candidates for the general elections between 1980 and 2004 (shown in this post). See some more examples of the Atlas data here. More data export options will be developed in the coming months. User feedback welcome.
*Update* UUorld is offering a $50 Rebate on the commercial version of UUorld with a receipt for an Atlas data purchase.
Election Night 2008 Timeline
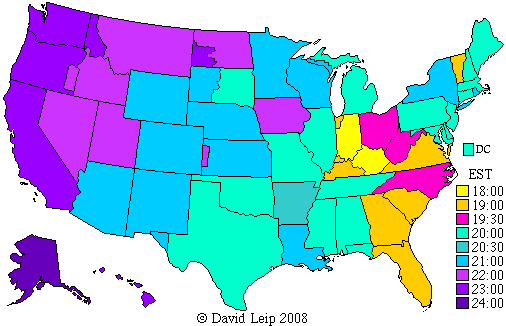 The 2008 Election Night Timeline is now available. Included are a national color-coded map of poll closing times and a table of the timeline for closing/call times for each state. Follow along on Election night as the states are called!
2008 Senatorial & Gubernatorial Endorsements
The Atlas feature to create user endorsements for 2008 Senatorial and Gubernatorial contests are now available. Endorse the candidates you support!
2008 Mock General Election
The Mock 2008 Presidential Election is now available.  This year’s contest includes a feature that allows visitors to treat their vote as an endorsement. With this option selected, a small banner appears below the state avatar in Forum Posts. Click on over and cast your ballot!
Primary Timelines
The site has a new feature – timelines for the 2008 Republican and Democratic Primaries. These pages show a summary of all the contests in chronological order, including vote percentages, estimated delegates, winning candidates, summary national map, pie charts, and county-map icons. Links are provided for each state summary results page. The timelines will automatically update following each event.
Test Post for National Map Widget
New Blog Interactive Election Map Widgets
I have created a new method for posting election results in Blogs – an interactive election map “widget” – a small snipet that can be placed in the code section of a blog post. The map has mouse-over interactivity, including a county-level imagemap with the floating text box of results plus links to more detailed returns. Below is an example comparing the 2004 General Election Result in South Carolina to the 2008 Republican Primary in South Carolina.
The link for this code may be seen by clicking on the link titled “Blog Interactive Map Widget Code for this Contest” in the “Election Tools” section of any state (or national) summary page. The code can then be placed in an uselectionatlas.org weblog post (note in order to use this widget, you need to enable the pageview plugin on the “Plugins” tab in the admin section of you weblog. At this time, this widget can’t be used on other weblogs since iframes are generally not permitted using most blogging software.
Untabulated Presidential Votes in 1940
I have found 12,301 votes cast in the 1940 General Election that have not been tabulated in any secondary source that I have looked at (including Congressional Quarterly and Clerk of the House).
In my annual drive between Eastern Massachusetts and Upstate New York, I often stop into a very deep repository of past election data – the New York State Library in Albany to collect additional past election data. This trip was a bit different, as I spent some time four floors above the library in the New York State Archives. Here, they have many original hand-written and typed records of election returns. Among the new data that I collected, was a sheet of write-in returns for the State of New York for the office of President in 1940. The document, titled “Statement of scattering vote cast as the General Election for Electors of President and Vice-President”, tabulated 12,301 write-ins for President.  These votes include 11,289 for Communist Party candidate Earl Browder, 121 votes for Socialist Labor candidate John Aiken, and 891 votes for scattered write-ins. The vast majority of these write-in votes were recorded in the New York City boroughs of Bronx, Kings, and New York, where Browder received about 0.5% of the vote in these Counties as a write-in. The document only includes write-ins for 12 of New York’s 62 counties. Some of the larger counties, such as Erie, are absent, so it is likely that there are even more votes for Browder that are uncounted. These votes will soon be added to the Atlas election results database.