The Presidential Predictions for the 2020 General Presidential Election are now open at this link. Provide prediction and confidence maps with analysis for the upcoming general Presidential Election. Compare with other users’ predictions and follow the expectations trend as the campaign progresses.
The official results posted by the Michigan Secretary of State for the 2016 Republican Presidential Primary includes a 3,000 vote error for Ted Cruz in Saginaw County. The Saginaw County Clerk posted the official Summary results showing Ted Cruz with 6,535 votes (3,966 votes in the 4th congressional district and 2,569 votes in the 5th congressional district). The county-level file posted by the Michigan Secretary of State shows the total figure for Saginaw County as 3,535 -> 3,000 votes less than the totals reported by the county. A review of the precinct report suggests the county figure is the correct one. The figures on the Atlas reflect this correction. The 2016 Michigan Presidential Primary Republican results can be seen here. Note that the error is not significant enough to change the delegate allocation.
The three contests for Governor in the 2015 General Election are now official and complete. The site has been updated to reflect the final data, including new county maps for the 2015 Gubernatorial General Election. The excel/csv dataset is also available for purchase on the store page.
Election predictions for the 2016 General Election are now open (U.S. President, U.S. Senate, and Governor). To help with picking winners, the polling database for the 2016 General Elections is also active. In 2012, the Atlas predictions for U.S. President had 81 users correctly call all 51 state-wide contests and all five congressional districts. The 2014 predictions were a bit tougher with nine users calling all states for U.S. Senate. Nobody called all 36 contests for Governor, given surprises in Maryland, Kansas, and Illinois. Good luck in this round!
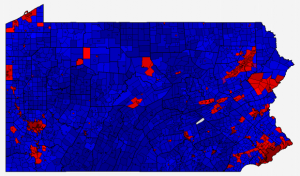
Pennsylvania 2012 Presidential Election Result Map by Municipality
The Pennsylvania 2012 presidential election results map by Municipality (City, Borough, Township) is now complete. Mitt Romney and Paul Ryan won a total of 2,031 municipalities while Barack Obama and Joe Biden won in 524 (11 were ties). This is a pickup for the Republican ticket vs. 2008, of 234 municipalities. Similar to many other states, the municipalities with the largest number of votes cast voted overwhelmingly Democratic, with Obama/Biden winning all of the top ten (Philadelphia, Pittsburgh, Allentown, Upper Darby, Erie, Lower Merion, Abington, Haverford, Scranton, and Millcreek) with a net margin of 656,882 votes. The bulk of the margin votes are from the city of Philadelphia where Obama received 85.2% of the vote, resulting in a margin of 492,339 votes. Romney’s largest margin in any municipality is 6,714 votes in Hampfield Township in Westmoreland County. The total aggregated margin in all 2,031 municipalities won by Romney is 696,033, slightly more than the Obama margin in the ten municipalities listed above. Full details, including party and swing maps can be viewed on the Pennsylvania 2012 Town page. The forum topic is located here.
For members, there are now available county township maps on the individual county results pages. In addition, the same maps and data are now available for President in the general elections of 2000, 2004, and 2008.
The 2012 Presidential Election Results map for Minnesota by county subdivision (City, Township, UT) is now complete. Mitt Romney and Paul Ryan won a total of 1,864 cities and townships while Barack Obama and Joe Biden won in 825 (37 were ties). This is a pickup for the Republican ticket vs. 2008, of 200 cities and towns. Similar to many other states, the municipalities with the largest populations voted overwhelmingly Democratic, with Obama/Biden winning nine of the top ten (Minneapolis, St. Paul, Rochester, Bloomington, Duluth, Plymouth, Eagan, Brooklyn Park, and Woodbury; Romney won Maple Grove) with a net margin of 258,206 votes. The state-wide margin of all 2,726 cities and townships is Democratic +225,942 votes. In the city of Minneapolis alone, Obama/Biden won 80.3% to 16.6%, a margin of 136,920 votes. Full details can be viewed on the Minnesota 2012 Town page. The forum topic is located here.
The total votes counted in the above table is 54,530 and is significantly lower than the 81,577 votes counted for President, 80,582 votes counted for U.S. House of Representatives, and 82,784 ballots cast. The drop-off is 33% relative to the Presidential Vote. The reason for this drop-off is because the figures for U.S. Senate as published by the Kansas Secretary of State are incorrect. The vote totals as published in the Statement of Votes Cast by the Shawnee County Election Office show the correct figures, repeated below:
Candidate
Party
Vote
Percentage
Samuel Brownback
Republican
53,491
67.2%
Lee Jones
Democratic
23,773
29.9%
Steven Rosile
Libertarian
1,396
1.8%
George Cook
Reform
980
1.2%
The total error is 25,110 votes. The missing votes are actually very similar percentage wise to the counted votes and do not impact the results of the contest. The Atlas database has been updated with these corrected results and can be seen here:
The 2015 Gubernatorial predictions for the general election to be held on November 3, 2015 are now active. Three states hold elections for their top executive office in 2015, Kentucky, Mississippi, and Louisiana. Add your prognostication here.