On July 2, 2013, the New York City Board of Elections printed a new “Statement and Return Report for Certification General Election – 11/06/2012” for Kings County (also known as Brooklyn Borough), adding a total of 6,470 ballots to the 2012 General Election tally, including 6,436 valid ballots cast for Presidential Candidates (34 ballots were under votes or over votes – referred to in New York as blanks or voids respectively).
Candidate
New Votes
%New Votes
Obama
5,497
85.42%
Romney
862
13.40%
Stein
46
0.71%
Johnson
27
0.42%
Lindsay
2
0.03%
Goode
1
0.02%
Ron Paul
1
0.02%
The new votes break down as shown in the table at left (figures for Obama reflect the fusion of Democratic and Working Families party ballot lines and Romney votes reflect the fusion of Republican and Conservative party ballot lines). This amended certification on 07/02/2013 follows previous certifications on 12/31/2012 and 3/19/2013. These latest figures have been incorporated into the Atlas (link to New York 2012 Presidential Summary Page. Thanks to @DKElections for the tip on amended results.
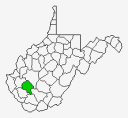
Boone County, WV tops the list of counties that displayed the largest swing percentage in the 2012 General Presidential Election. In the 2008 General Election, Barack Obama won Boone County 54% to 43%. In 2012, Mitt Romney turned around this 10.7% Republican loss into a 31.5% Republican win, defeating Barack Obama 64% to 33%. The total swing was 42.2% toward the Republican candidate. This is the first time a Republican has won in Boone County since the 1972 Richard Nixon landslide and only the second time since 1924.
Located in southern West Virginia, adjacent to the south of Kanawha County, Boone County is in the mountain top removal coal mining region in the Appalachian Mountains of southern West Virginia, extreme southwestern Virginia, and eastern Kentucky. The swing percentage towards the Republican candidate amongst many of these more traditionally Democratic counties is impressive as shown in the table below:
County
Swing 2008-2012
Region Swing Map
Boone, WV
42.2%
Knott, KY
39.7%
McDowell, WV
38.4%
Pike, KY
36.7%
Webster, WV
33.1%
Magoffin, KY
32.8%
Floyd, KY
32.6%
Nicholas, WV
32.0%
Gallatin, IL
31.1%
Wyoming, WV
30.6%
Nine of the top ten swing counties are all located in the same region (darkest blue on the map shows counties where the swing is greater than 30%), a convincing indication of the dislike of many residents of this area to the positions of the incumbent President during his reelection bid.
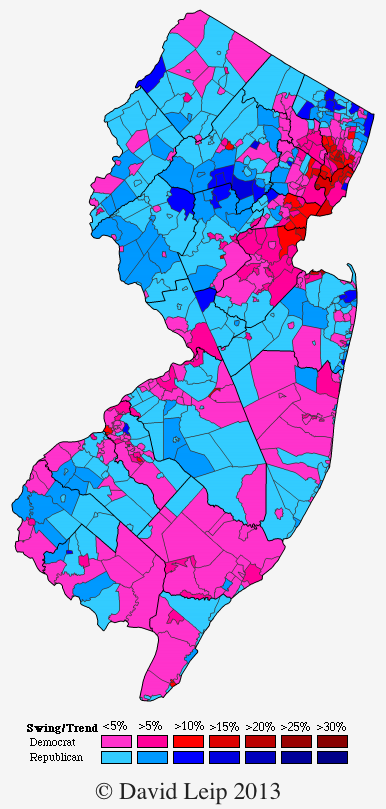
One way to look at geographical election trends is the swing map – defined as the change in margin between the top two parties from election to election. For example, if County A is won by the Democrat in 2008 with 54% of the vote to 46% and by the Republican in 2012 with 51% of the vote to 49%, the swing is 10 percentage points towards the Republican (D+8 to R+2). The maps can be used to highlight variables of an election such as home state advantage (see Robert Dole in 1996), candidate positions (example: 2012 shift in eastern Kentucky), and many more.
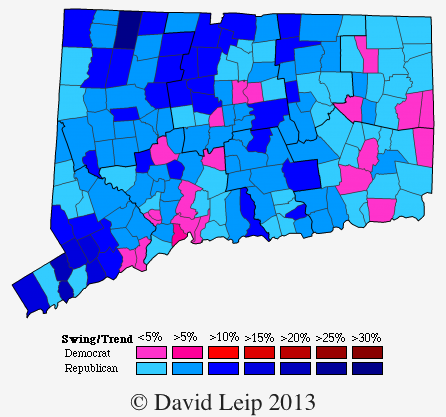
Another example from 2012 is the New Jersey Swing Map by municipality shown at right (click the map to enlarge). New Jersey is one of only six states that swung towards the Democratic party in the 2012 General Election (complete list of the 2012 presidential swing results by state). New Jersey is a unique case in 2012 because just days before the election, the area was struck by a powerful post-tropical cyclone (formerly known as Hurricane Sandy), causing immense damage. Among much misfortune, the storm also disrupted the election process. The most recent official results by the New Jersey Department of State Division of Elections wasn’t posted until February 6, 2013 and even this tally does not capture all the votes from each county (amended results in Essex, Monmouth, and Morris counties are included in the Atlas, but are not included in the Division of Elections tally). Analyzing the electoral impact of such an event is complex, but given the swing map above when compared to the nation as a whole and even nearby states such as Connecticut, it appears to suggest that many citizens of New Jersey responded favorably at the ballot box to the incumbent President Obama’s response to the crisis.
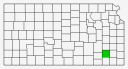
The 2012 General Election official Vote Totals as reported by the Kansas Secretary of State Elections & Legislative division includes results from Wilson County that are double-counted. Wilson County has a relatively small population of 9,409 as enumerated by the U.S. Census Bureau in 2010 (estimated population of July 2012 is 9,105) and is located east of Wichita and south of Topeka as shown in the map at right. The table below shows the officially reported results for President in Wilson County:
Official Reported
Presidential Candidate
Vice Presidential Candidate
Political Party
Popular Vote
Willard Mitt Romney
Paul Ryan
Republican
5,650
76.00%
Barack H. Obama
Joseph R. Biden, Jr.
Democratic
1,636
22.01%
Gary Johnson
James P. Gray
Libertarian
94
1.26%
Chuck Baldwin
Joseph Martin
Reform
54
0.73%
The sum of the votes cast for President as reported is 7,434. However, the Kansas 2012 General Election Official Turnout Report shows only 3,752 ballots cast and 5,845 registered voters in Wilson County. Furthermore, the total counted votes for President in 2008 was 4,121. Upon inspection of the 2012 Kansas General Election Results by Precinct, it becomes clear that the votes for each candidate are counted twice. The Atlas database has been updated to reflect the correct data.


 On July 2, 2013, the New York City Board of Elections printed a new “Statement and Return Report for Certification General Election – 11/06/2012” for Kings County (also known as Brooklyn Borough), adding a total of 6,470 ballots to the 2012 General Election tally, including 6,436 valid ballots cast for Presidential Candidates (34 ballots were under votes or over votes – referred to in New York as blanks or voids respectively).